WENDY’S COMPANY Reports Decreased Revenue But Increased Net Income in Q4 FY2022.
March 6, 2023

Earnings report
On December 31 2022, WENDY’S COMPANY ($NASDAQ:WEN) reported their financial results for the fourth quarter of FY2022, ending on March 1 2023. Despite this decline in revenue, there was an increase in net income of 13.4% to USD 536.5 million compared to the same period of the previous year. This is a positive sign for the company and suggests that it is on track to meet its financial goals. Despite these challenges, it managed to grow its net income due to cost-cutting measures such as restructuring operations, increasing efficiency, and reducing overhead expenses.
Additionally, WENDY’S COMPANY increased its digital presence, which contributed to the growth of its online sales during the fourth quarter. Overall, WENDY’S COMPANY reports a decreased revenue for the fourth quarter of FY2022 but a promising increase in net income. This suggests that despite the economic and market challenges of the pandemic, the company is still well-positioned for continued growth and profitability in the future.
Price History
On Wednesday, WENDY’S COMPANY stock opened at $22.3 and closed at $22.2, up by 1.1% from prior closing price of 22.0. The company believes the decrease in revenues was caused by the pandemic and supply chain disruptions, but was able to reduce costs and increase revenue efficiency to offset losses. Live Quote…
About the Company
Income Snapshot
Below shows the total revenue, net income and net margin for Wendy’s Company. More…
| Total Revenues | Net Income | Net Margin |
| 2.1k | 177.37 | 8.5% |
Cash Flow Snapshot
Below shows the cash from operations, investing and financing for Wendy’s Company. More…
| Operations | Investing | Financing |
| 259.9 | -77.78 | 288.67 |
Balance Sheet Snapshot
Below shows the total assets, liabilities and book value per share for Wendy’s Company. More…
| Total Assets | Total Liabilities | Book Value Per Share |
| 5.5k | 5.03k | 2.19 |
Key Ratios Snapshot
Some of the financial key ratios for Wendy’s Company are shown below. More…
| 3Y Rev Growth | 3Y Operating Profit Growth | Operating Margin |
| 7.0% | 7.7% | 17.5% |
| FCF Margin | ROE | ROA |
| 8.3% | 50.6% | 4.2% |
Analysis
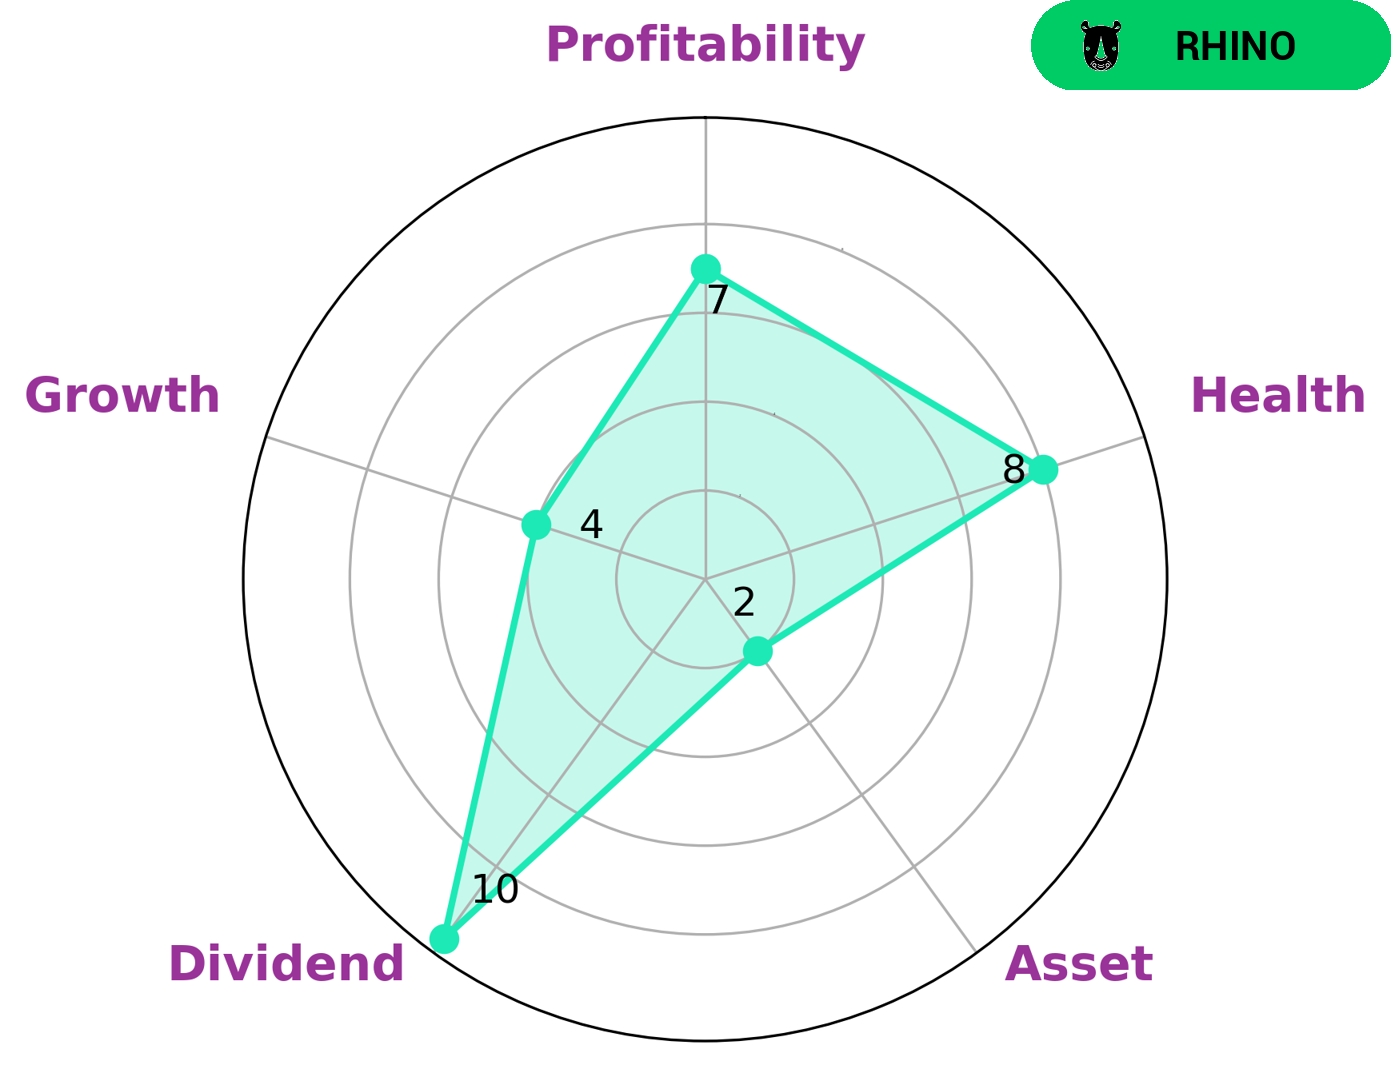
As a financial expert and analyst, I have been asked to analyze the financials of WENDY’S COMPANY using GoodWhale. After reviewing their financials, GoodWhale’s Star Chart classified the company as a ‘rhino’, meaning that it has achieved moderate growth in its revenue or earnings. Based on this classification, investors interested in a solid dividend yield and consistent profitability may be interested in WENDY’S COMPANY. On the other hand, the company is only medium in terms of growth and weak in terms of asset, which could present a challenge for investors more interested in aggressive growth and return on asset. However, WENDY’S COMPANY’s financials also indicate that it has a high health score of 8/10 with regard to its cashflows and debt. This score indicates that the company can reliably ride out any crisis safely, as it is not at risk of bankruptcy. More…
Peers
In the quick-service restaurant industry, the Wendy’s Co. competes with McDonald’s Corp, Chipotle Mexican Grill Inc, and Yum Brands Inc. All of these companies are trying to attract customers with fresh, high-quality food at a reasonable price. Wendy’s Co. has an advantage over its competitors because it is a smaller company and can be more nimble in its response to customer trends.
– McDonald’s Corp ($NYSE:MCD)
McDonald’s Corp has a market cap of 187.28B as of 2022, a Return on Equity of -90.17%. McDonald’s Corporation is an American fast food company, founded in 1940 as a restaurant operated by Richard and Maurice McDonald, in San Bernardino, California, United States. They rechristened their business as a hamburger stand. The first McDonald’s franchise using the arches logo opened in Phoenix, Arizona in 1953. Businessman Ray Kroc joined the company as a franchise agent in 1955. He subsequently purchased the chain from the McDonald brothers and oversaw its worldwide growth.
– Chipotle Mexican Grill Inc ($NYSE:CMG)
Founded in 1993, Chipotle Mexican Grill is a chain of restaurants that primarily serves Mexican-style cuisine, including tacos and burritos. As of December 31, 2020, there were 2,724 Chipotle restaurants in the United States, Canada, the United Kingdom, France, and Germany. The company has a market cap of $43.03B as of 2022 and a return on equity of 27.52%.
– Yum Brands Inc ($NYSE:YUM)
Yum Brands Inc is a publicly traded American fast food company with more than 40,000 locations in over 140 countries. The company operates the brands KFC, Pizza Hut, and Taco Bell. Yum Brands is headquartered in Louisville, Kentucky.
Yum Brands Inc has a market cap of 31.59B as of 2022. The company has a Return on Equity of -15.87%. Yum Brands Inc is a publicly traded American fast food company with more than 40,000 locations in over 140 countries. The company operates the brands KFC, Pizza Hut, and Taco Bell. Yum Brands is headquartered in Louisville, Kentucky.
Summary
Wendy’s Company reported total revenue of $41.3 million, a 20.8% decrease from the same period the previous year. However, their net income saw an increase of 13.4%, amounting to $536.5 million. This suggests that the company has managed to make changes to their business model and operations that have enabled them to become more profitable. For investors, this may be a positive sign when considering a potential investment in the company.
Related Posts


Recent Posts


Investing Everyone Can Do.
Investing shouldn’t be exclusive to a select few. We believe everyone should have the opportunity to grow their wealth. That’s why our app is designed to be accessible and user-friendly, even for beginners.
