VIPER ENERGY PARTNERS LP Reports 45.0% Revenue Decrease and 22.8% Net Income Increase for FY2022 Q4
March 3, 2023

Earnings report
VIPER ENERGY PARTNERS LP ($NASDAQ:VNOM) reported their FY2022 Q4 earnings results for the fourth quarter of the year ending December 31, 2022. Total revenue was USD 21.7 million, representing a substantial 45.0% decrease from the same period in the prior year. A major contributor to this drop in revenue is attributable to lower realized commodity sales in the oil and gas sector. Conversely, net income was USD 203.4 million, a 22.8% increase from the same quarter in the previous year.
These results reinforce VIPER ENERGY PARTNERS LP’s commitment to providing investors with a solid financial return, even amidst challenging market conditions. The company remains focused on achieving long-term success and continuing to create value for its shareholders.
Share Price
VIPER ENERGY PARTNERS LP reported its fourth-quarter earnings on Tuesday, revealing a 45.0% decrease in revenue year-over-year, but a 22.8% increase in net income during the same period. Despite this, the company’s stock opened at $30.2 and closed at $29.5, down by 1.7% from the previous closing price of $30.0. Over the past year, VIPER ENERGY PARTNERS LP has seen an overall decline in revenue, but its net income has remained relatively steady. The company is focused on building out its portfolio of midstream energy assets and increasing its presence in the global oil and gas industry. Live Quote…
About the Company
Income Snapshot
Below shows the total revenue, net income and net margin for VNOM. More…
| Total Revenues | Net Income | Net Margin |
| 865.77 | 151.31 | 18.8% |
Cash Flow Snapshot
Below shows the cash from operations, investing and financing for VNOM. More…
| Operations | Investing | Financing |
| 699.8 | 47.57 | -768.64 |
Balance Sheet Snapshot
Below shows the total assets, liabilities and book value per share for VNOM. More…
| Total Assets | Total Liabilities | Book Value Per Share |
| 2.92k | 598.85 | 9.43 |
Key Ratios Snapshot
Some of the financial key ratios for VNOM are shown below. More…
| 3Y Rev Growth | 3Y Operating Profit Growth | Operating Margin |
| 42.7% | 52.1% | 76.6% |
| FCF Margin | ROE | ROA |
| 73.6% | 58.6% | 14.2% |
Analysis
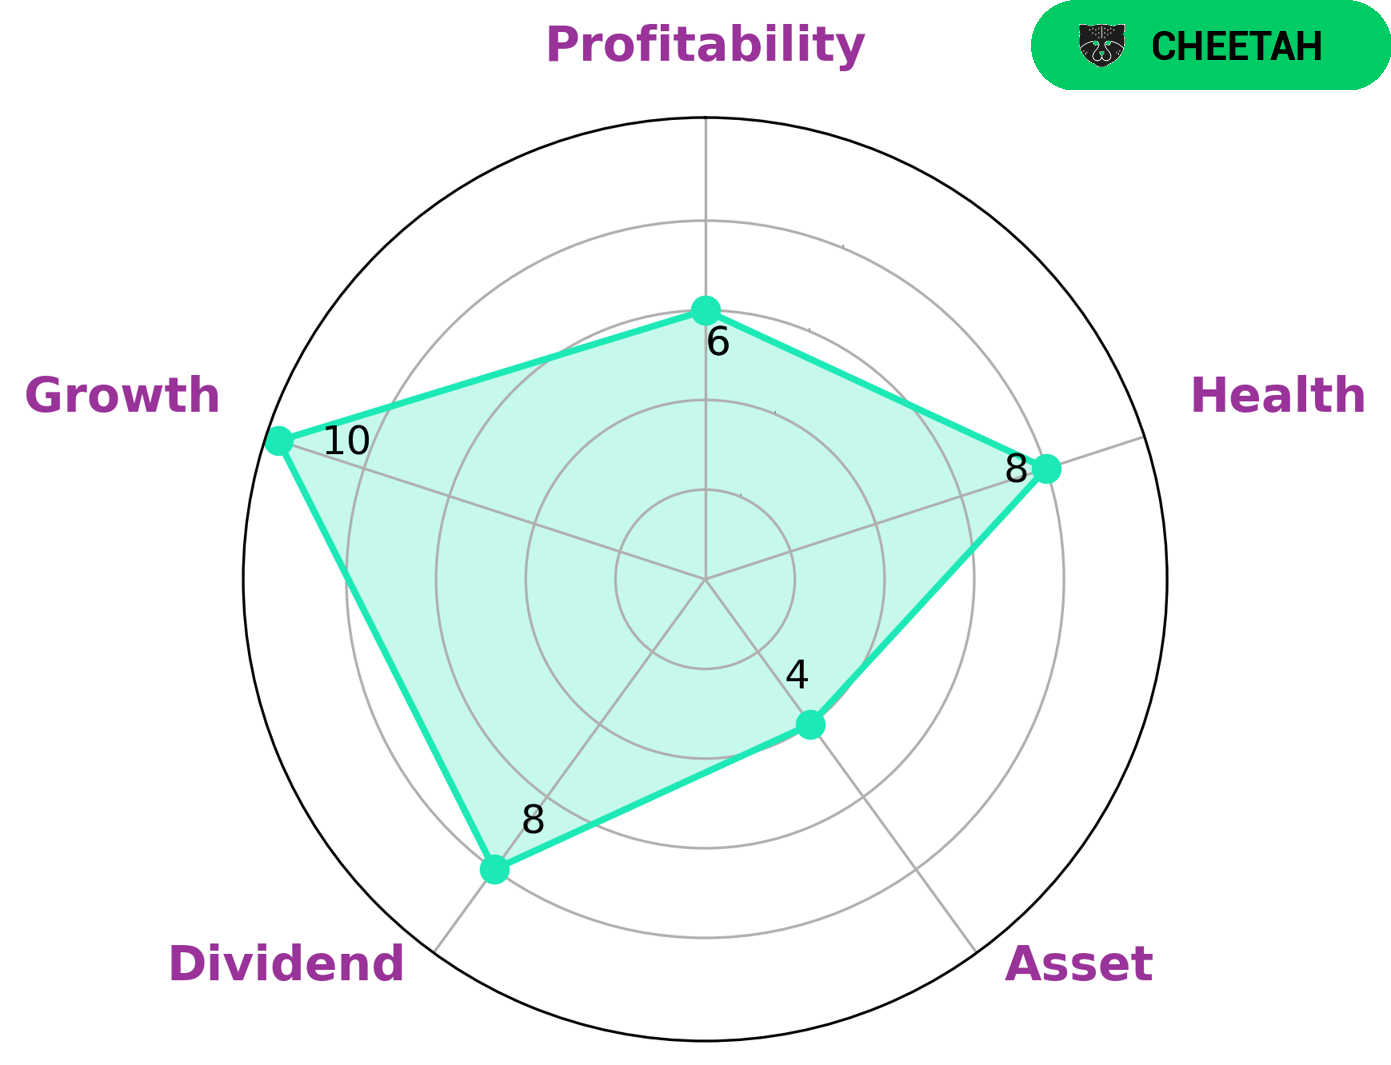
At GoodWhale, we conducted an analysis of VIPER ENERGY PARTNERS LP’s welfare. After our analysis with the Star Chart, we found that VIPER ENERGY PARTNERS LP had strong points in its dividend and growth, and medium points in asset and profitability. We also found that VIPER ENERGY PARTNERS LP had a high health score of 8/10 with regards to its cashflows and debt, meaning it is capable of safely riding out any crisis without the risk of bankruptcy. Given its strong points in dividend and growth, as well as its safe ability to ride out crisis, we believe that VIPER ENERGY PARTNERS LP would be attractive to investors who are more risk-averse, yet are looking for a company that has potential for high growth. More…
Peers
The oil and gas industry is a highly competitive market. There are many oil and gas companies that compete for market share. One of the most competitive markets is the market for oil and gas exploration and production. In this market, there are many companies that compete for market share. One of the most competitive companies in this market is Viper Energy Partners LP. The company is a publicly traded company that is listed on the New York Stock Exchange. The company has a market capitalization of $2.6 billion. The company operates in the oil and gas industry in the United States, Canada, and Mexico.
– Rubellite Energy Inc ($TSX:RBY)
Rubellite Energy Inc is a Canadian oil and gas company with a market cap of 153.23M as of 2022. The company is engaged in the exploration, development, and production of oil and gas properties in the Western Canada Sedimentary Basin.
– Basic Energy Corp ($PSE:BSC)
Basic Energy Corp. is a holding company, which engages in the provision of oilfield services. It operates through the following segments: Drilling Services, Well Services, and Manufacturing and Repair. The Drilling Services segment offers onshore drilling rigs and related services. The Well Services segment provides pressure pumping and other well services. The Manufacturing and Repair segment manufactures and repairs equipment used in oil and gas drilling, completion, and production operations. The company was founded on April 28, 1987 and is headquartered in Houston, TX.
– BPI Energy Holdings Inc ($OTCPK:BPIGF)
BPI Energy Holdings Inc is a publicly traded holding company that owns and operates businesses in the energy sector. The company has a market cap of 146.97k as of 2022 and a Return on Equity of -513.73%. BPI Energy Holdings Inc owns and operates businesses in the oil and gas, power generation, and renewable energy industries. The company’s businesses include exploration and production, power generation, and energy trading.
Summary
On a more positive note, net income was up 22.8% year-over-year, at USD 203.4 million. Despite the decrease in revenues, investors in the energy sector may be buoyed by the strong increase in net income and consider VIPER ENERGY PARTNERS LP as an attractive opportunity.
Related Posts


Recent Posts


Investing Everyone Can Do.
Investing shouldn’t be exclusive to a select few. We believe everyone should have the opportunity to grow their wealth. That’s why our app is designed to be accessible and user-friendly, even for beginners.
