RED ROCK RESORTS Reports Profits for FY2023 Q2 on June 30 2023
August 6, 2023

☀️Earnings Overview
RED ROCK RESORTS ($NASDAQ:RRR) reported total revenue of USD 416.1 million for FY2023 Q2 on June 30, 2023, a 1.4% drop from the same quarter in the previous year. Interestingly, net income showed an increasing trend, with a 150.9% year-on-year rise to USD 39.5 million.
Price History
The company’s stock opened at $47.3 on Thursday and closed at $47.2, showing 1.3% decrease from its closing price of last day which was $47.8. The CEO of RED ROCK RESORTS stated that the company’s focus on cost control and management optimization has enabled them to maintain the level of profits in a highly competitive market. Moreover, they are also focusing on diversifying their portfolio with new projects in order to drive growth in their business. Live Quote…
About the Company
Income Snapshot
Below shows the total revenue, net income and net margin for RRR. More…
| Total Revenues | Net Income | Net Margin |
| 1.69k | 225.55 | 11.8% |
Cash Flow Snapshot
Below shows the cash from operations, investing and financing for RRR. More…
| Operations | Investing | Financing |
| 525.28 | -442.14 | -290.05 |
Balance Sheet Snapshot
Below shows the total assets, liabilities and book value per share for RRR. More…
| Total Assets | Total Liabilities | Book Value Per Share |
| 3.52k | 3.42k | 1.29 |
Key Ratios Snapshot
Some of the financial key ratios for RRR are shown below. More…
| 3Y Rev Growth | 3Y Operating Profit Growth | Operating Margin |
| 6.2% | 118.5% | 37.3% |
| FCF Margin | ROE | ROA |
| -10.3% | 524.2% | 11.2% |
Analysis
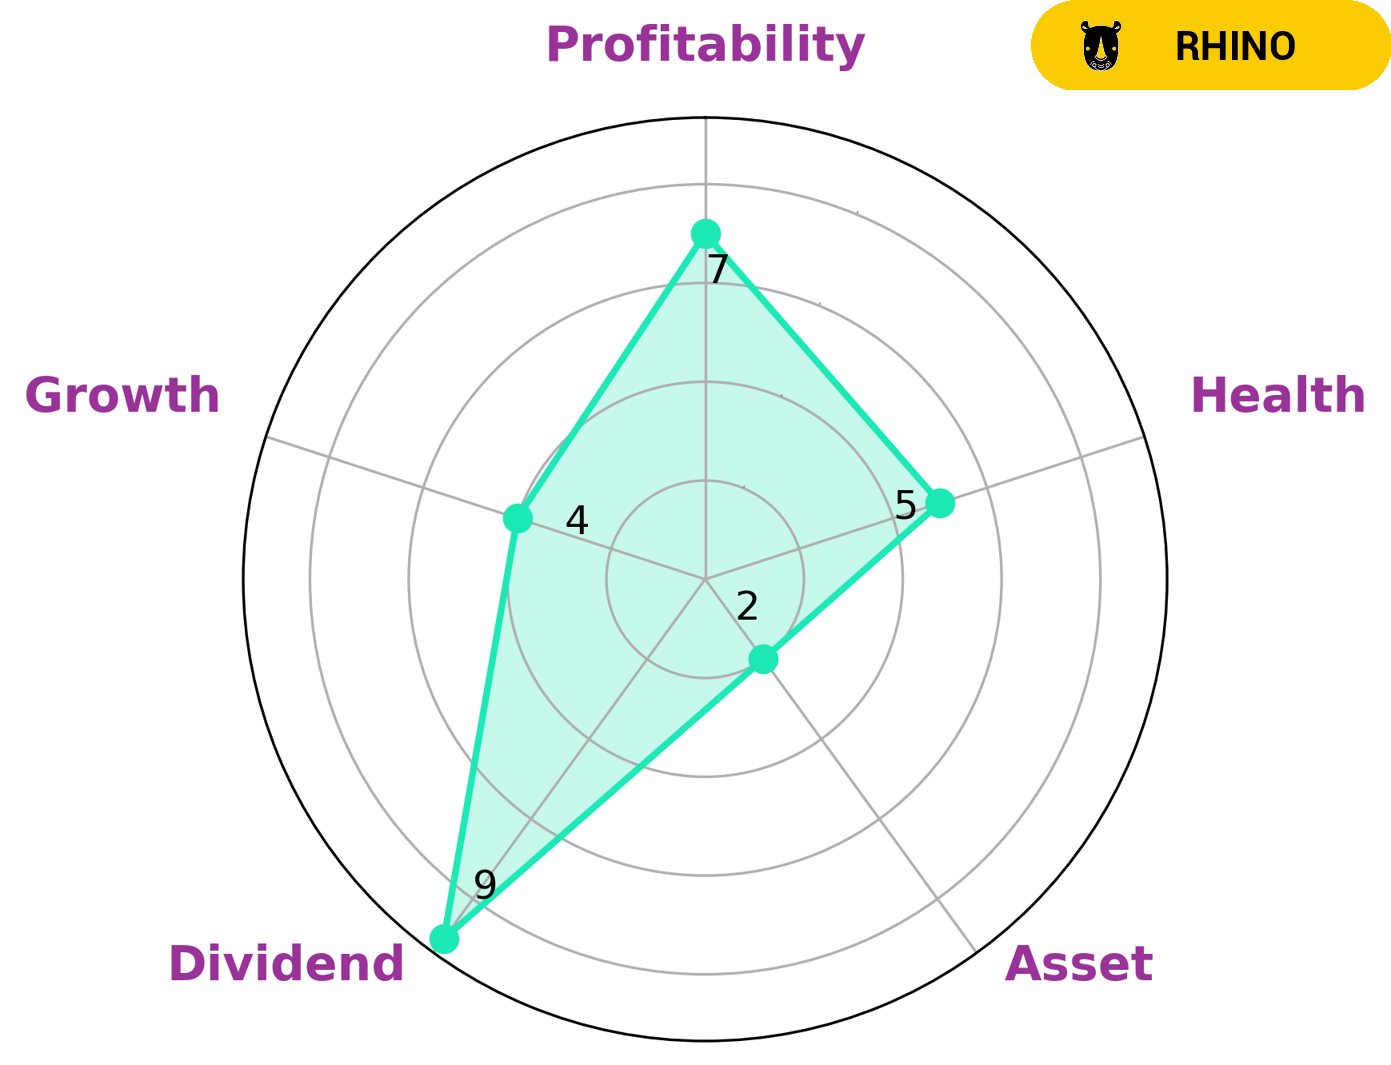
We at GoodWhale conducted an analysis of RED ROCK RESORTS’s wellbeing. According to our Star Chart, RED ROCK RESORTS is classified as a ‘cow’, a type of company that we conclude has the track record of paying out consistent and sustainable dividends. As a result, this type of company may be attractive to investors who value dividend yields and steady returns. Our analysis also showed that RED ROCK RESORTS is strong in dividend and profitability, but weak in asset and growth. Moreover, RED ROCK RESORTS has an intermediate health score of 6/10 with regard to its cashflows and debt, meaning it is likely to effectively pay off its debt and fund future operations. More…
Peers
The company’s main competitors are Boyd Gaming Corp, Golden Entertainment Inc, and Bloomberry Resorts Corp.
– Boyd Gaming Corp ($NYSE:BYD)
Boyd Gaming Corporation is a leading diversified owner and operator of 22 gaming entertainment properties located in Nevada, Illinois, Indiana, Iowa, Kansas, Louisiana, Mississippi and Ohio. Boyd Gaming press releases are available at boydgaming.com. Additional information about Boyd Gaming can be found at https://www.boydgaming.com/.
The company has a market cap of 5.86B as of 2022 and a ROE of 36.77%. The company operates gaming entertainment properties located in various states in the US.
– Golden Entertainment Inc ($NASDAQ:GDEN)
As of 2022, Golden Entertainment, Inc. had a market capitalization of 1.19 billion and a return on equity of 28.98%. The company is a gaming and hospitality company that owns and operates casinos, taverns, and gaming machines in the United States.
– Bloomberry Resorts Corp ($PSE:BLOOM)
The company’s market cap stands at 77.45B as of 2022 and its ROE is 11.83%. The company is engaged in the business of developing, owning and operating resorts.
Summary
RED ROCK RESORTS has experienced a 1.4% decrease in total revenue for the second quarter of their 2023 fiscal year, but their net income has increased by 150.9% year over year. This suggests that their strategies to reduce costs and optimize resources have been successful in improving their bottom line. Investors may consider this a positive sign of long-term profitability.
Furthermore, strong cash flow and cost-cutting measures could provide additional support for the company’s stock price. It is recommended that investors watch the company’s performance over the next several quarters closely in order to make an informed investment decision.
Related Posts


Recent Posts


Investing Everyone Can Do.
Investing shouldn’t be exclusive to a select few. We believe everyone should have the opportunity to grow their wealth. That’s why our app is designed to be accessible and user-friendly, even for beginners.
