HAYNES INTERNATIONAL Reports 11.7% Increase in Revenue for FY2023 Q4
November 26, 2023

☀️Earnings Overview
On November 16, 2023, HAYNES INTERNATIONAL ($NASDAQ:HAYN) reported total revenue of USD 160.6 million for FY2023 Q4 ending September 30, 2023, up 11.7% from the same period in the prior year. Unfortunately, net income was USD 13.1 million, down 19.6% year over year.
Analysis
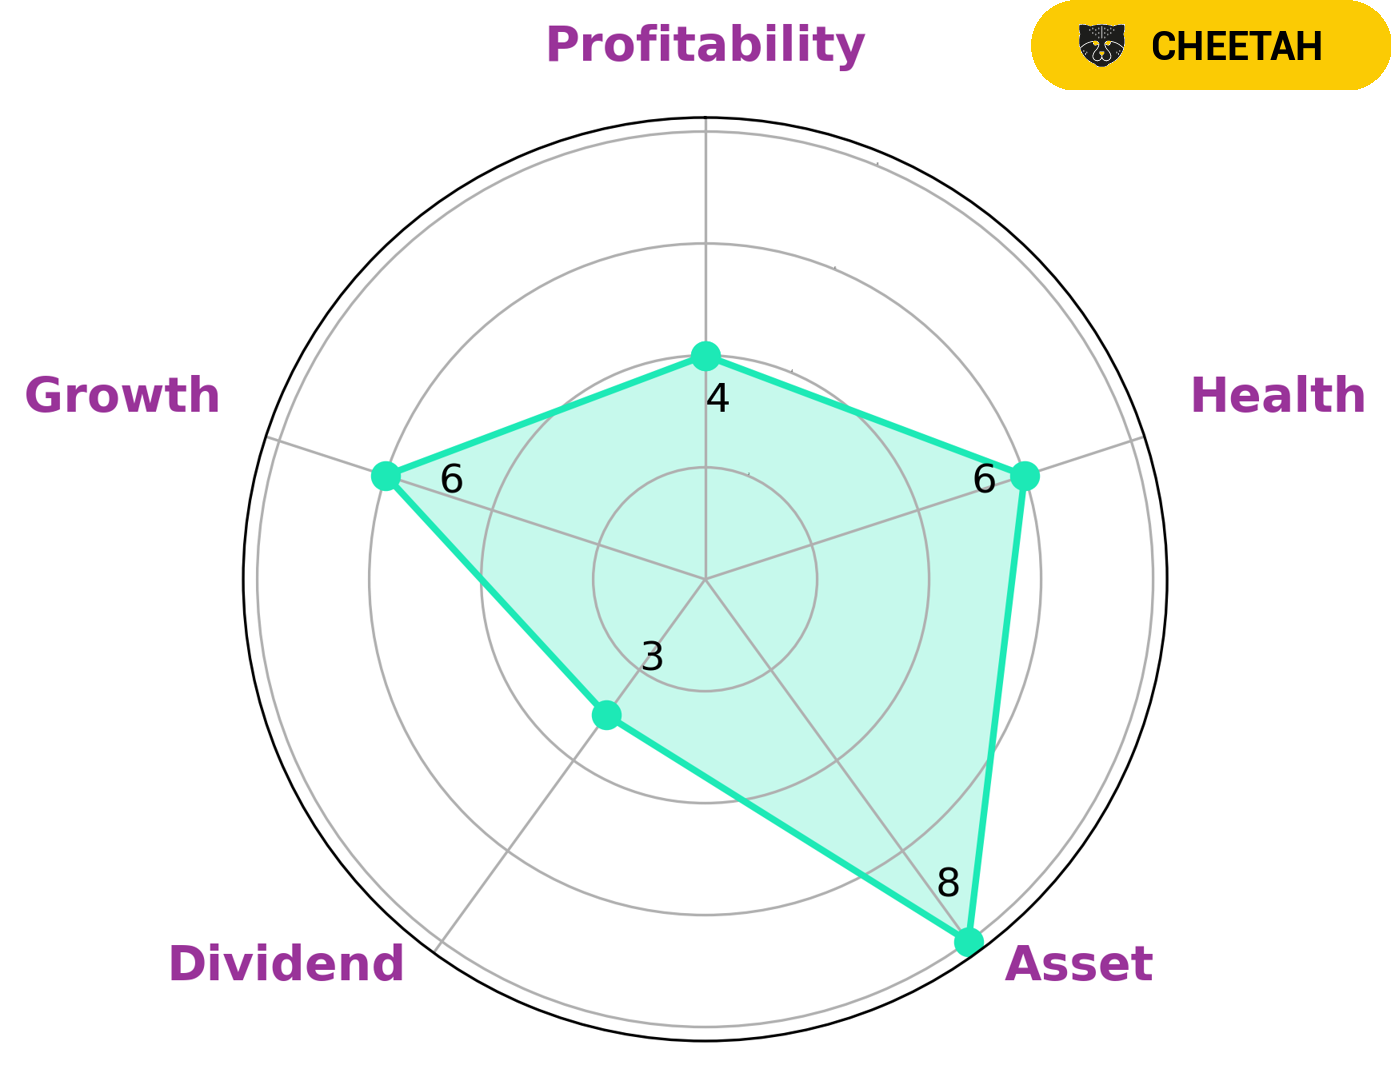
GoodWhale conducted an analysis of HAYNES INTERNATIONAL‘s wellbeing and results showed that it had a strong asset rating, medium ratings in growth, profitability, and a weak dividend rating. From this assessment, GoodWhale classified HAYNES INTERNATIONAL as a “cheetah”, a type of company that achieved high revenue or earnings growth but is considered less stable due to lower profitability. Given the nature of this type of company, investors who are seeking potential capital gains may be interested. HAYNES INTERNATIONAL has an intermediate health score of 6/10 considering its cashflows and debt. This implies that it might be able to safely ride out any crisis without the risk of bankruptcy. Therefore, investors who are looking for short-term gains may be attracted to this company. More…
About the Company
Income Snapshot
Below shows the total revenue, net income and net margin for Haynes International. More…
| Total Revenues | Net Income | Net Margin |
| 589.96 | 41.65 | 7.1% |
Cash Flow Snapshot
Below shows the cash from operations, investing and financing for Haynes International. More…
| Operations | Investing | Financing |
| -16.72 | -16.4 | 34.59 |
Balance Sheet Snapshot
Below shows the total assets, liabilities and book value per share for Haynes International. More…
| Total Assets | Total Liabilities | Book Value Per Share |
| 706.28 | 271.96 | 34.11 |
Key Ratios Snapshot
Some of the financial key ratios for Haynes International are shown below. More…
| 3Y Rev Growth | 3Y Operating Profit Growth | Operating Margin |
| 15.7% | 354.9% | 10.1% |
| FCF Margin | ROE | ROA |
| -5.6% | 8.8% | 5.3% |
Peers
The company’s alloys are used in a variety of industries, including aerospace, chemical processing, and power generation. Haynes International‘s main competitors are Allegheny Technologies Inc, Thermodynetics Inc, HydrogenPro AS.
– Allegheny Technologies Inc ($NYSE:ATI)
Allegheny Technologies Inc is a specialty metals company with a market cap of 3.88B as of 2022. They have a Return on Equity of 13.59%. The company produces and sells a variety of specialty metals and alloys, including stainless steel, titanium, and nickel-based alloys. They serve a wide range of industries, including aerospace, chemical processing, oil and gas, and power generation.
– Thermodynetics Inc ($OTCPK:TDYT)
Thermodynetics Inc is a company that manufactures and sells heat exchangers and related products. The company has a market capitalization of 97.5 million and a return on equity of 831.89%. The company’s products are used in a variety of industries, including automotive, aerospace, and chemical processing. Thermodynetics has a strong market presence and is a leading supplier of heat exchangers in North America. The company’s products are backed by a team of experienced engineers and a quality management system that is ISO 9001:2008 certified.
– HydrogenPro AS ($OTCPK:HYPRF)
Hydrogen Pro AS has a market cap of 186.33M as of 2022. It is a Return on Equity of -9.52%. The company produces hydrogen fuel cells and related technologies. Its products are used in a variety of applications, including transportation, stationary power, and portable power.
Summary
HAYNES INTERNATIONAL reported its earnings for FY2023 Q4, showing an 11.7% increase in total revenue to USD 160.6 million. Despite this growth, net income fell 19.6% year over year to USD 13.1 million. Investors should be wary of this decline, as it reflects a decrease in profitability and could indicate issues with the company’s operations. It is important to monitor HAYNES INTERNATIONAL’s financial performance over the upcoming quarters to ensure that the company has sufficient liquidity, profitability, and growth potential.
Related Posts


Recent Posts


Investing Everyone Can Do.
Investing shouldn’t be exclusive to a select few. We believe everyone should have the opportunity to grow their wealth. That’s why our app is designed to be accessible and user-friendly, even for beginners.
