ABM INDUSTRIES Reports 4.5% Year-Over-Year Increase in Total Revenue for Second Quarter of FY2023
June 15, 2023

☀️Earnings Overview
ABM INDUSTRIES ($NYSE:ABM) saw total revenue of USD 1984.0 million for the second quarter of FY2023, ending April 30th 2023, representing a year-on-year increase of 4.5%. Correspondingly, net income rose 6.4% to USD 51.9 million from the same quarter the previous year.
Analysis
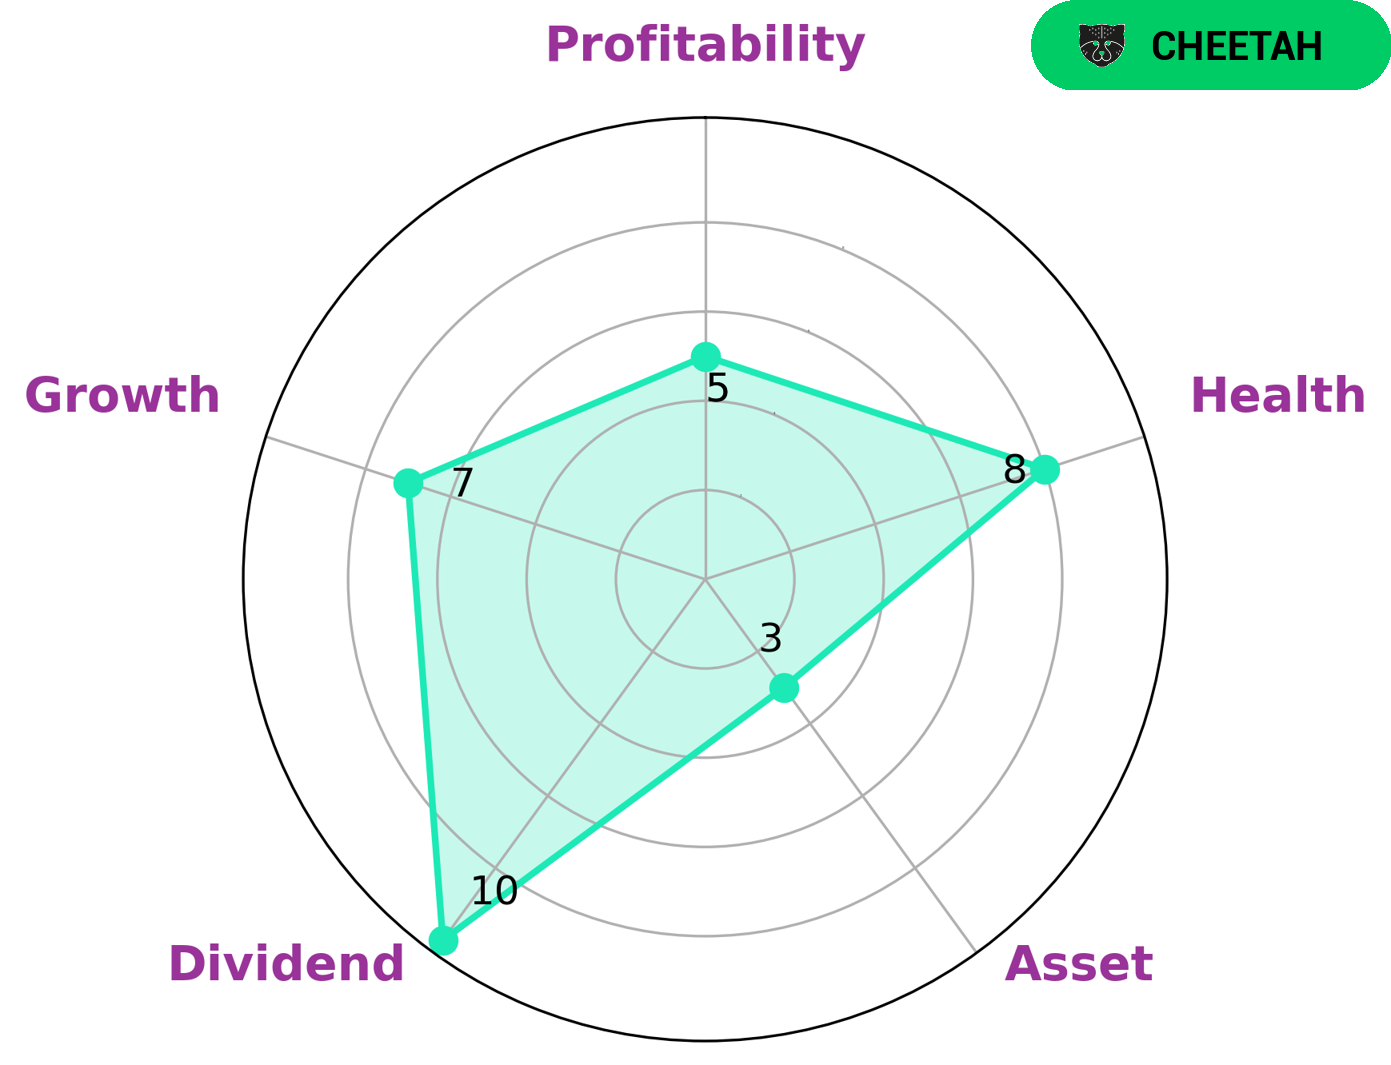
GoodWhale has examined the fundamentals of ABM INDUSTRIES and according to Star Chart, the company has been classified as a ‘cheetah’ type of company. This implies that while ABM INDUSTRIES has achieved high revenue or earnings growth, it is considered less stable due to its lower profitability. Investors who are looking for higher returns and are comfortable with taking more risks may be interested in investing in ABM INDUSTRIES. Moreover, ABM INDUSTRIES has a high health score of 8/10 considering its cashflows and debt, indicating that the company is capable to sustain future operations in times of crisis. The company is strong in dividend and growth, medium in profitability, and weak in asset. These factors make ABM INDUSTRIES an attractive option for investors who are seeking short-term gains in the stock market. More…
About the Company
Income Snapshot
Below shows the total revenue, net income and net margin for Abm Industries. More…
| Total Revenues | Net Income | Net Margin |
| 7.95k | 196 | 2.5% |
Cash Flow Snapshot
Below shows the cash from operations, investing and financing for Abm Industries. More…
| Operations | Investing | Financing |
| 112.9 | -188.2 | 97.1 |
Balance Sheet Snapshot
Below shows the total assets, liabilities and book value per share for Abm Industries. More…
| Total Assets | Total Liabilities | Book Value Per Share |
| 4.93k | 3.15k | 26.27 |
Key Ratios Snapshot
Some of the financial key ratios for Abm Industries are shown below. More…
| 3Y Rev Growth | 3Y Operating Profit Growth | Operating Margin |
| 7.5% | 12.1% | 4.2% |
| FCF Margin | ROE | ROA |
| 0.7% | 12.1% | 4.2% |
Peers
As the competition heats up, ABM Industries Inc will have to make sure that their services remain the best in the industry in order to stay ahead of their competitors.
– Mader Group Ltd ($ASX:MAD)
Mader Group Ltd is a leading global provider of construction services, specializing in the mining and energy sectors. With a market cap of 714M as of 2022, the company is well positioned to continue to grow and expand its business. Mader Group Ltd has a very impressive Return on Equity (ROE) of 33.68%, which is significantly higher than the industry average of 14%. This indicates that the company is making effective use of its equity to generate excellent returns for its shareholders. Mader Group Ltd is well-positioned to capitalize on growth opportunities in the global construction and energy sectors.
– Teleperformance SE ($OTCPK:TLPFF)
Teleperformance SE is a global leader in customer experience management and business process outsourcing. Founded in 1978, the company specializes in providing customer care, technical support, and digital integrated services across multiple channels. As of 2022, Teleperformance SE has a market capitalization of 13.34B. Its return on equity (ROE) is 16.41%, which indicates a high return on the invested capital relative to its competitors. This strong ROE is testament to the company’s ability to generate value for its shareholders by efficiently using its resources.
– Dexterra Group Inc ($TSX:DXT)
Dexterra Group Inc is a Canadian company that specializes in providing enterprise mobility solutions and services to its clients. The company has a market cap of 335.95M as of 2022, which represents its current market value. Its Return on Equity (ROE) is 4.62%, which refers to the amount of net income earned compared to the company’s total equity. The company’s current ROE is lower than the industry average, indicating that it is creating less value for its shareholders than its peers. Overall, Dexterra Group Inc is a reliable provider of enterprise mobility solutions and services and its market cap and ROE can be taken as indicators of its stability and potential for growth.
Summary
ABM Industries recently reported strong financials for the second quarter of their fiscal year 2023 with total revenue increasing 4.5% year-over-year to $1984 million, and net income increasing 6.4% to $51.9 million. This news saw the stock price move up the same day, indicating the market sentiment is positive in terms of ABM Industries’ financial performance and potential for continuing growth. Investors may want to take note of the company’s solid fundamentals and consider adding ABM Industries to their portfolio.
Related Posts


Recent Posts


Investing Everyone Can Do.
Investing shouldn’t be exclusive to a select few. We believe everyone should have the opportunity to grow their wealth. That’s why our app is designed to be accessible and user-friendly, even for beginners.
