Capital One Financial Reports Decrease in Non-GAAP EPS and Revenue
April 29, 2023

Trending News 🌥️
The reports showed a decrease in both Non-GAAP EPS and revenue. The Non-GAAP EPS was reported at $2.31, which fell short of expectations by $1.62. Revenue of $8.9B was lower than anticipated by $170M, leading to a decrease in profits year-over-year. The decrease in income was attributed to higher operating costs, lower card sales volume, and a decline in other income.
In response to the lower numbers, the company has implemented cost cutting measures to help offset some of the losses. Despite the lower numbers, Capital ($NYSE:COF) One is still well-positioned for the future, with a strong balance sheet and an impressive portfolio of products and services for their customers. While earnings may not have met expectations for the second quarter, the company remains committed to providing financial solutions and support for their customers during these uncertain times.
Price History
The company’s stock opened at $95.0 and closed at $96.0, up by 1.7% from the previous closing price of 94.4. Despite these reports, investors seemed to remain optimistic about the company’s future, as evidenced by the stock’s increased value. Nevertheless, it is clear that the company is dedicated to the success of its investors, as evidenced by its share price increase. Live Quote…
About the Company
Income Snapshot
Below shows the total revenue, net income and net margin for COF. More…
| Total Revenues | Net Income | Net Margin |
| 34.25k | 7.04k | 21.7% |
Cash Flow Snapshot
Below shows the cash from operations, investing and financing for COF. More…
| Operations | Investing | Financing |
| 13.81k | -29.74k | 25.13k |
Balance Sheet Snapshot
Below shows the total assets, liabilities and book value per share for COF. More…
| Total Assets | Total Liabilities | Book Value Per Share |
| 455.25k | 402.67k | 133.15 |
Key Ratios Snapshot
Some of the financial key ratios for COF are shown below. More…
| 3Y Rev Growth | 3Y Operating Profit Growth | Operating Margin |
| 6.2% | – | – |
| FCF Margin | ROE | ROA |
| 37.6% | 11.2% | 1.3% |
Analysis
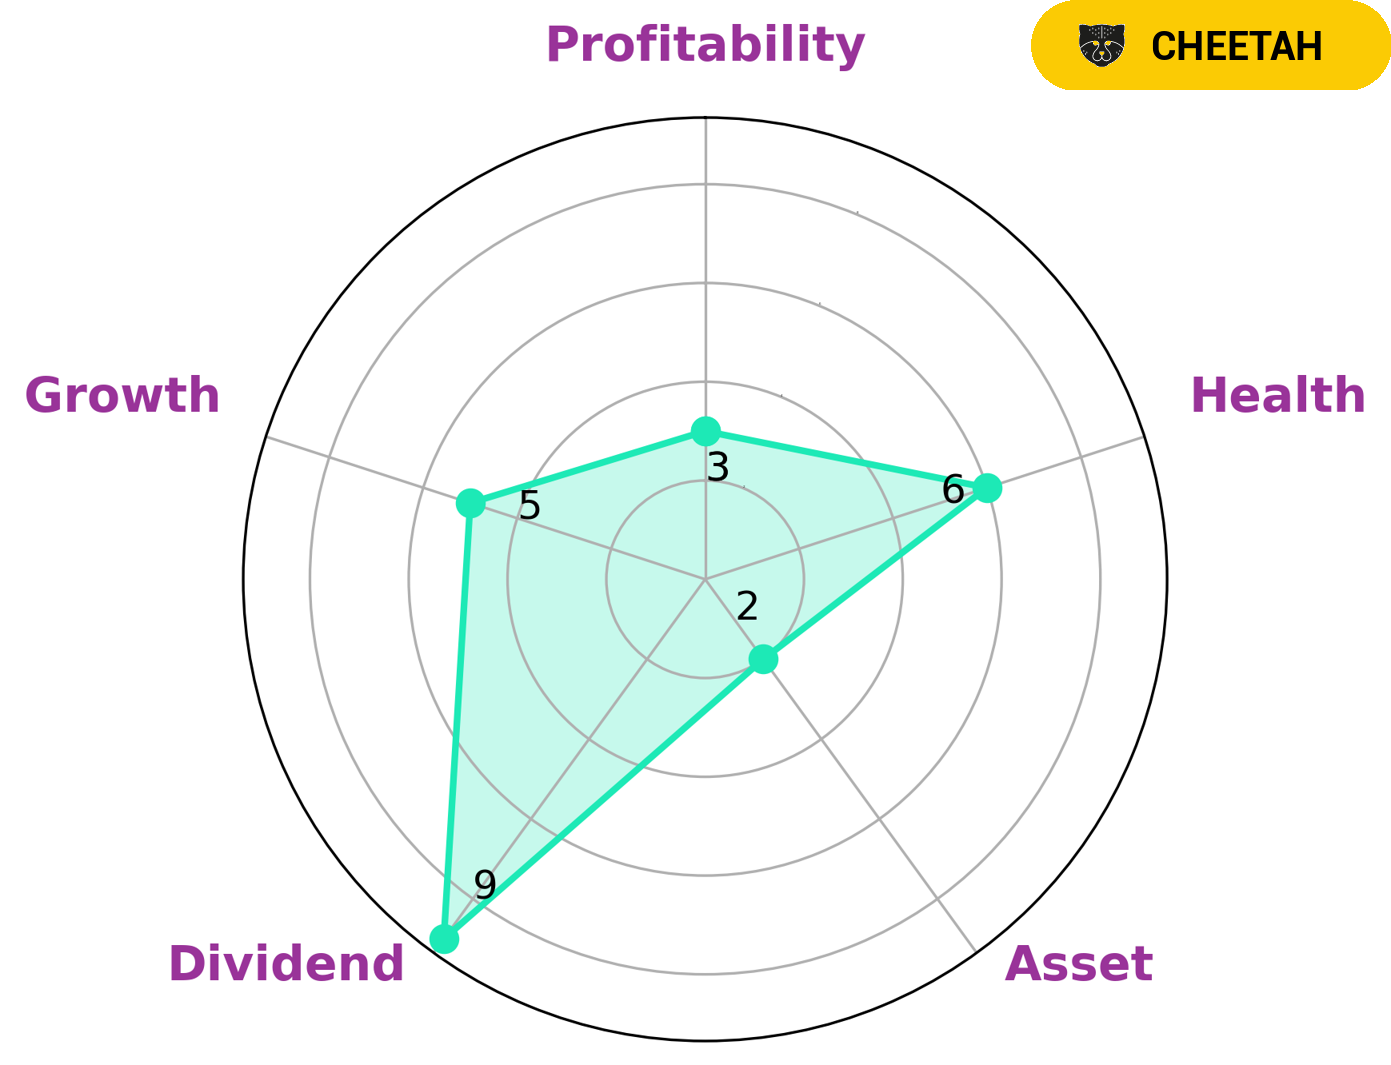
GoodWhale conducted an analysis of CAPITAL ONE FINANCIAL’s fundamentals and based on our Star Chart, we determined that it is classified as a ‘cheetah’–a type of company that has achieved high revenue or earnings growth but is considered less stable due to lower profitability. In terms of health score, CAPITAL ONE FINANCIAL scored 6/10 with regard to its cashflows and debt, indicating that it is likely to ride out any crisis without the risk of bankruptcy. Given its characteristics, CAPITAL ONE FINANCIAL may be attractive to investors who are looking for companies with high dividend yields and moderate growth potential. Its weak profitability rating could be seen as a downside, but its strong debt position and intermediate health score could mitigate this risk. More…
Peers
In the financial world, competition is fierce. Capital One Financial Corp is up against some tough competition from Hanhua Financial Holding Co Ltd, Oportun Financial Corp, and Jianpu Technology Inc. All of these companies are fighting for a piece of the pie, and they are all hoping to come out on top. Capital One has been a top player in the financial game for a while now, but its competitors are quickly catching up. It will be interesting to see how this competition plays out in the coming years.
– Hanhua Financial Holding Co Ltd ($SEHK:03903)
Hanhua Financial Holding Co Ltd has a market cap of 1.29B as of 2022, a Return on Equity of 0.78%. The company operates in the financial services industry in China, providing banking and other financial services to corporate and individual customers.
– Oportun Financial Corp ($NASDAQ:OPRT)
Oportun Financial is a publicly traded company with a market capitalization of 164.64 million as of 2022. The company has a return on equity of 9.05%. Oportun Financial is a provider of financial services to underserved consumers and small businesses in the United States. The company offers unsecured personal loans, small business loans, and related products and services.
– Jianpu Technology Inc ($NYSE:JT)
Jianpu Technology Inc is a Chinese internet company that provides an online platform for users to find and compare credit products. As of 2022, the company had a market cap of 33.89 million and a return on equity of -35.21%. The company’s platform offers users access to credit products from a variety of financial institutions, including banks, credit card companies, and online lenders.
Summary
Capital One Financial Corporation recently reported its quarterly earnings with a Non-GAAP earnings per share of $2.31, falling short of consensus estimates by $1.62. Revenue was also down at $8.9B, missing estimates by $170M. Long-term investors should note the company’s competitive advantages and focus on its ability to maintain competitive yields and increase efficiency in its operations. While investors may need to exercise caution in the near-term, the long-term outlook for Capital One Financial remains positive.
Related Posts


Recent Posts


Investing Everyone Can Do.
Investing shouldn’t be exclusive to a select few. We believe everyone should have the opportunity to grow their wealth. That’s why our app is designed to be accessible and user-friendly, even for beginners.
