Sally Beauty Delivers Beat on Both Earnings and Revenue
May 5, 2023

Trending News ☀️
It is the largest specialty retailer in the world, with a presence in the U.S., Canada, Germany, Mexico, and other international markets. Recently, Sally Beauty ($NYSE:SBH) reported Non-GAAP earnings per share (EPS) of $0.41, exceeding expectations by $0.04 and revenue of $918.71M, surpassing estimates by $29.71M. This was driven by a shift to digital platforms as well as the launch of new products that provided customers with greater value and convenience. Moreover, Sally Beauty’s costs decreased due to a combination of lower overhead expenses and cost-cutting initiatives taken during the pandemic.
This enabled the company to maximize profitability and post strong earnings and revenue figures for the quarter. Overall, these results showcase Sally Beauty’s resilience in the face of challenging economic conditions. The company has proven to be responsive to customer demand and able to quickly adjust to changing market conditions in order to maintain its position as a leading provider of professional beauty supplies.
Price History
At the opening bell, SALLY BEAUTY‘s stock was priced at $14.2 but closed the day at $12.0, a decrease of 13.1% from the previous closing price of $13.9. This positive news points to a promising outlook for the company going forward. Live Quote…
About the Company
Income Snapshot
Below shows the total revenue, net income and net margin for Sally Beauty. More…
| Total Revenues | Net Income | Net Margin |
| 3.79k | 165.05 | 5.1% |
Cash Flow Snapshot
Below shows the cash from operations, investing and financing for Sally Beauty. More…
| Operations | Investing | Financing |
| 217.14 | -100.72 | -309.49 |
Balance Sheet Snapshot
Below shows the total assets, liabilities and book value per share for Sally Beauty. More…
| Total Assets | Total Liabilities | Book Value Per Share |
| 2.67k | 2.3k | 3.48 |
Key Ratios Snapshot
Some of the financial key ratios for Sally Beauty are shown below. More…
| 3Y Rev Growth | 3Y Operating Profit Growth | Operating Margin |
| -0.6% | -7.6% | 8.2% |
| FCF Margin | ROE | ROA |
| 3.1% | 58.4% | 7.3% |
Analysis
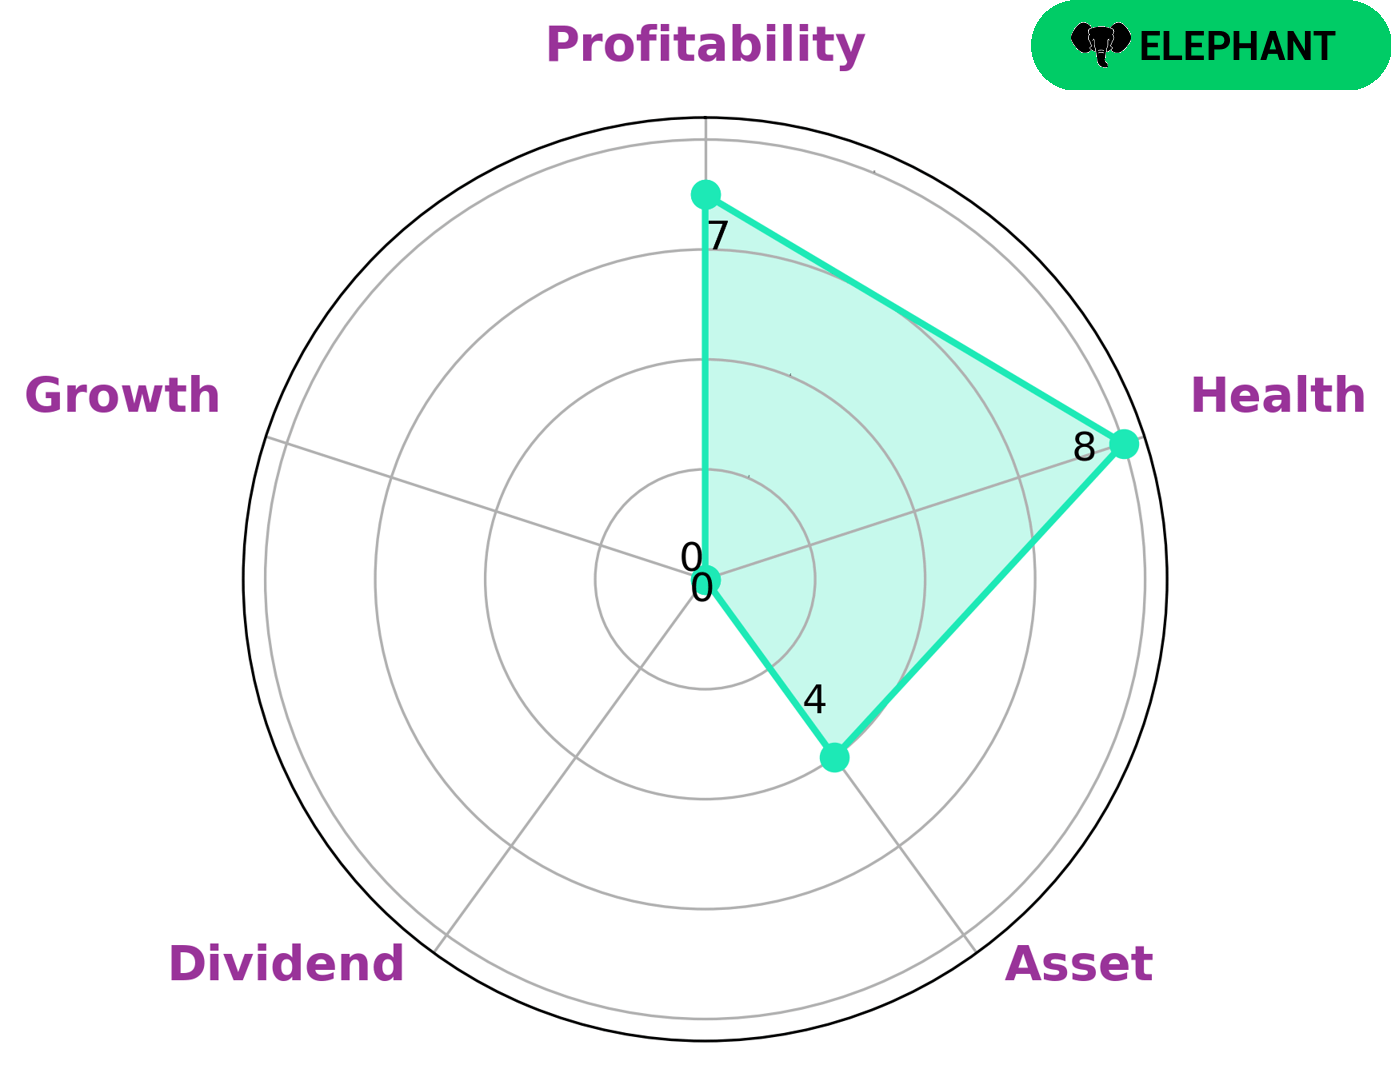
At GoodWhale, we conducted an analysis of SALLY BEAUTY‘s wellbeing and the results are quite favorable. Our Star Chart shows that SALLY BEAUTY has a high health score of 8/10 with regard to its cashflows and debt, indicating that the company is capable of sustaining future operations even in times of crisis. In terms of profitability, SALLY BEAUTY scored well and could be considered to be strong. Its asset score was medium but its dividend and growth scores were weak. Based on this analysis, we classified SALLY BEAUTY as an ‘elephant’, a company that is rich in assets after liabilities are deducted off. Given this analysis, investors who are looking for a stable company with good cashflows, as well as those who want to invest in a company with strong asset value, may be interested in SALLY BEAUTY. More…
Peers
The beauty industry is a competitive one, with many different companies vying for market share. Sally Beauty Holdings Inc is one such company, and it competes against Adore Beauty Group Ltd, Matas A/S, and Boutiques Inc, among others. While each company has its own strengths and weaknesses, Sally Beauty Holdings Inc has been able to stay ahead of the competition and maintain a leading position in the industry.
– Adore Beauty Group Ltd ($ASX:ABY)
Adore Beauty Group Ltd is an Australian-based company that retails beauty products. It has a market capitalization of 150.6 million as of 2022 and a return on equity of 5.82%. The company offers a wide range of products including skincare, haircare, makeup, and fragrances. It also provides a platform for beauty experts to share their tips and tricks with the Adore Beauty community.
– Matas A/S ($LTS:0QFA)
Matas A/S is a large publicly traded company with a market capitalization of 2.84 billion as of 2022. The company has a strong return on equity of 8.02%. Matas A/S is a leading retailer in Denmark with over 1,000 stores. The company offers a wide variety of products including cosmetics, health, and beauty products.
– Boutiques Inc ($TSE:9272)
Boutiques Inc is a publicly traded company that designs, manufactures, and sells women’s clothing and accessories. The company was founded in 2001 and is headquartered in New York City. As of 2022, Boutiques Inc had a market capitalization of $13.97 billion and a return on equity of 20.46%. The company’s products are sold through its own retail stores, as well as through department stores and online retailers.
Summary
The stock has upside potential in the long run, as Sally Beauty continues to invest in its digital footprint and omni-channel distribution capabilities in order to increase customer engagement and further drive revenue growth.
Related Posts


Recent Posts


Investing Everyone Can Do.
Investing shouldn’t be exclusive to a select few. We believe everyone should have the opportunity to grow their wealth. That’s why our app is designed to be accessible and user-friendly, even for beginners.
