Five Below Posts Quarterly EPS Above Estimates, Revenue Misses Expectations
June 2, 2023

🌧️Trending News
Five Below ($NASDAQ:FIVE), Inc. is a leading retailer of extreme value merchandise for teens and pre-teens. Recently, Five Below posted its quarterly earnings per share (EPS) above the estimates, but fell short of the revenue expectations. According to the Generally Accepted Accounting Principles (GAAP), Five Below’s EPS was at $0.67, exceeding the expectations by $0.04. This was despite the company’s revenue of $726.25M which fell short of the estimated amount by $1.96M.
The losses could be attributed to an increase in the company’s operating expenses related to new store openings and investments in digital capabilities. In light of these results, Five Below’s management is optimistic about their future prospects and plans to further expand their store base in the coming quarters.
Earnings
FIVE BELOW recently released their FY2023 Q4 earning report as of January 31 2023, which showed an overall 12.7% increase in total revenue to 1122.75M USD compared to the same period the previous year. Net income also saw a 22.2% year-on-year increase to 171.32M USD. This is an impressive feat considering that FIVE BELOW’s total revenue has grown from 858.51M USD to 1122.75M USD in the past 3 years. However, their total revenue was not able to meet expectations, proving that the company still has a way to go before reaching its full potential.
About the Company
Income Snapshot
Below shows the total revenue, net income and net margin for Five Below. More…
| Total Revenues | Net Income | Net Margin |
| 3.08k | 261.53 | 8.5% |
Cash Flow Snapshot
Below shows the cash from operations, investing and financing for Five Below. More…
| Operations | Investing | Financing |
| 314.93 | -3.94 | -43.63 |
Balance Sheet Snapshot
Below shows the total assets, liabilities and book value per share for Five Below. More…
| Total Assets | Total Liabilities | Book Value Per Share |
| 3.32k | 1.96k | 24.52 |
Key Ratios Snapshot
Some of the financial key ratios for Five Below are shown below. More…
| 3Y Rev Growth | 3Y Operating Profit Growth | Operating Margin |
| 18.5% | 16.7% | 11.2% |
| FCF Margin | ROE | ROA |
| 2.0% | 16.9% | 6.5% |
Share Price
The report showed that earnings per share (EPS) had exceeded expectations, but revenue had missed projections. The stock opened the day at $170.9 and closed at $169.4, down 1.8% from its last closing price of 172.5. Despite the missed expectations for revenue, investors seemed to take the earnings report in stride, as the stock only fell by a modest amount on the news. Live Quote…
Analysis
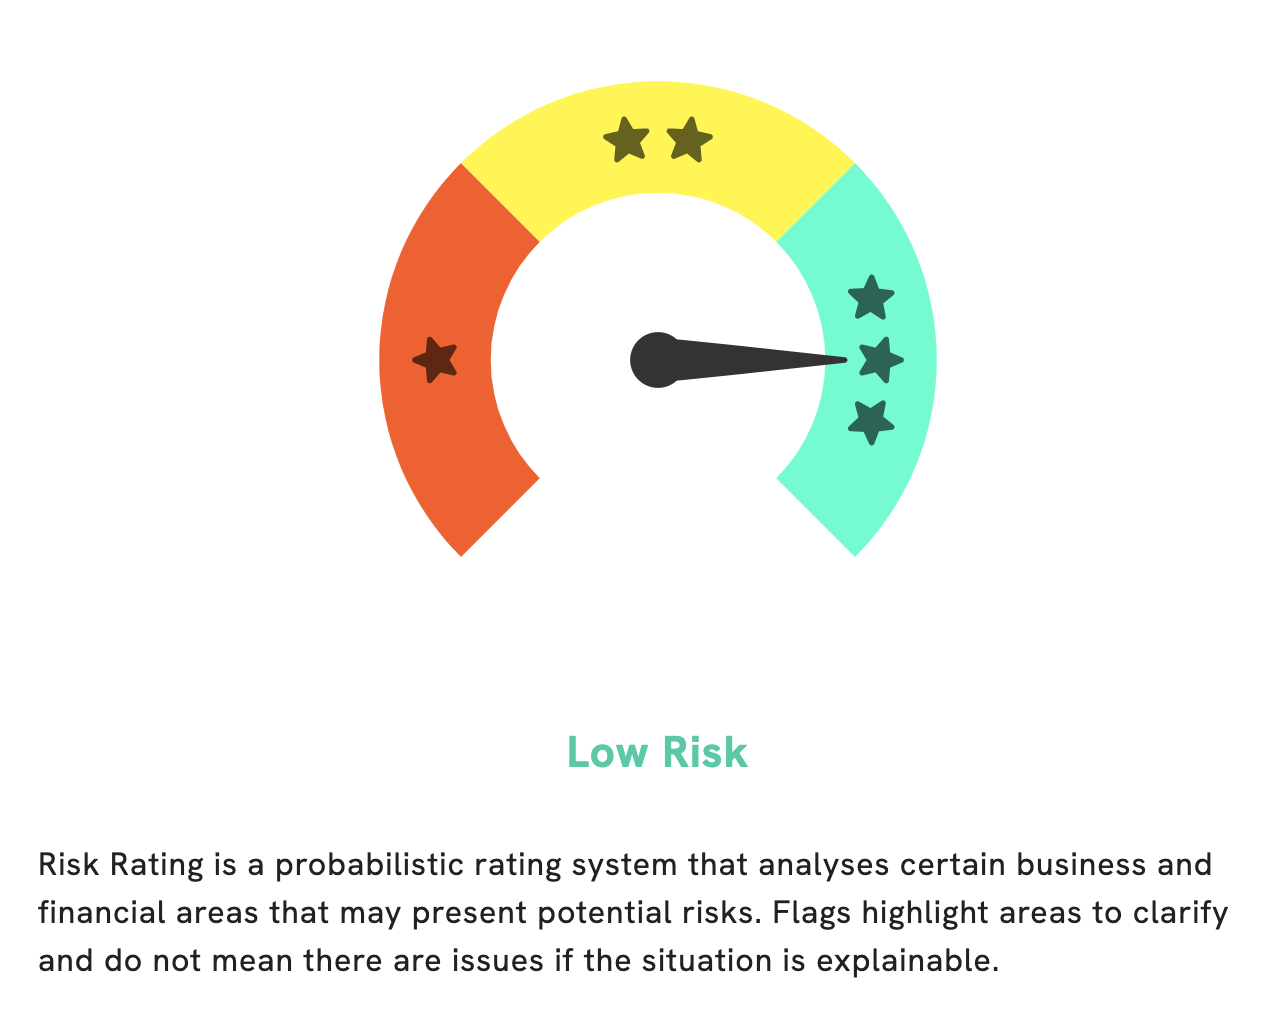
At GoodWhale, we’ve conducted an in-depth analysis of FIVE BELOW‘s fundamentals. Our Risk Rating puts FIVE BELOW in the low-risk category in terms of financial and business aspects. This is good news for investors considering this stock. However, our analysis also detected 1 risk warning on the company’s balance sheet. To get a clearer understanding of the situation and make an informed decision, we encourage you to register with us. With us, you’ll get access to our detailed assessment, which would give you the information you need to make a sound investment choice. More…
Peers
Despite the intense competition, Five Below Inc continues to thrive and has managed to carve out a niche for itself in the market.
– Ross Stores Inc ($NASDAQ:ROST)
Ross Stores Inc is a chain of American off-price department stores. It operates under two brands, Ross and dd’s DISCOUNTS. As of 2022, the company had a market cap of 40.44B, making it one of the largest retailers in the United States. In addition, Ross Stores Inc also has a strong Return on Equity (ROE) of 29.12%, which indicates that the company is making effective use of its shareholders’ funds. The company’s success is attributed to its effective management strategies and cost containment practices. The company has been able to maintain its market share and profitability despite the presence of competitors.
– O’Reilly Automotive Inc ($NASDAQ:ORLY)
O’Reilly Automotive Inc is an American retail company specializing in the distribution of automotive aftermarket parts, tools, supplies, equipment and accessories. As of 2022, O’Reilly Automotive Inc has a market capitalization of 50.97 billion US dollars, making it one of the largest publicly traded auto parts retailers in the US. The company’s Return on Equity (ROE) stands at -159.26%, indicating that it is not generating enough returns for its shareholders. Despite this, the company continues to focus on expanding its operations in order to increase its market share and profitability.
– Kirkland’s Inc ($NASDAQ:KIRK)
Kirkland’s Inc is a specialty retailer of home décor, furniture, and gifts. It has a market cap of 46.43M as of 2022, which is relatively low compared to other companies in the home décor industry. Despite this, the company has still managed to maintain a negative Return on Equity (-43.0%) which indicates that the company has failed to generate a return on the investments of its shareholders. This could be due to their lack of resources, or because their current strategy may not be optimal for creating shareholder value.
Summary
Five Below’s strong balance sheet, liquidity position, and ability to drive customer traffic will likely continue to support its operations and fuel further growth.
Related Posts


Recent Posts


