GRACO INC Reports Record Q2 Earnings with Impressive Revenue Increase
April 27, 2023

Trending News ☀️
Graco Inc ($NYSE:GGG)., a publicly-traded stock and global leader in fluid handling solutions, has seen impressive growth in their second-quarter earnings. On top of that, Graco’s total revenue of $529.6M was higher than anticipated by $27.73M from the previous quarter. This impressive increase in performance is attributed to increased sales in both the manufacturing and industrial divisions, as well as a higher average selling price for the company’s products.
Overall, Graco Inc. is in a very stable and profitable position. With the impressive growth in their second quarter earnings and the positive outlook for their products and services, the company is well-positioned to continue to experience success in the coming quarters and years.
Price History
Despite this positive news, GRACO INC stock opened at $69.4 and closed at $69.0, down by 1.6% from prior closing price of 70.1. This was a surprising development given the strong overall earnings report and the positive outlook for the company and its products. While analysts are still trying to determine the cause of this dip in stock prices, investors remain hopeful that GRACO INC’s continued success will result in a steady rise in stock prices in the future. Live Quote…
About the Company
Income Snapshot
Below shows the total revenue, net income and net margin for Graco Inc. More…
| Total Revenues | Net Income | Net Margin |
| 2.14k | 460.64 | 21.5% |
Cash Flow Snapshot
Below shows the cash from operations, investing and financing for Graco Inc. More…
| Operations | Investing | Financing |
| 377.39 | -226.82 | -434.4 |
Balance Sheet Snapshot
Below shows the total assets, liabilities and book value per share for Graco Inc. More…
| Total Assets | Total Liabilities | Book Value Per Share |
| 2.44k | 579.25 | 11.09 |
Key Ratios Snapshot
Some of the financial key ratios for Graco Inc are shown below. More…
| 3Y Rev Growth | 3Y Operating Profit Growth | Operating Margin |
| 9.2% | 10.5% | 26.9% |
| FCF Margin | ROE | ROA |
| 8.2% | 19.7% | 14.8% |
Analysis
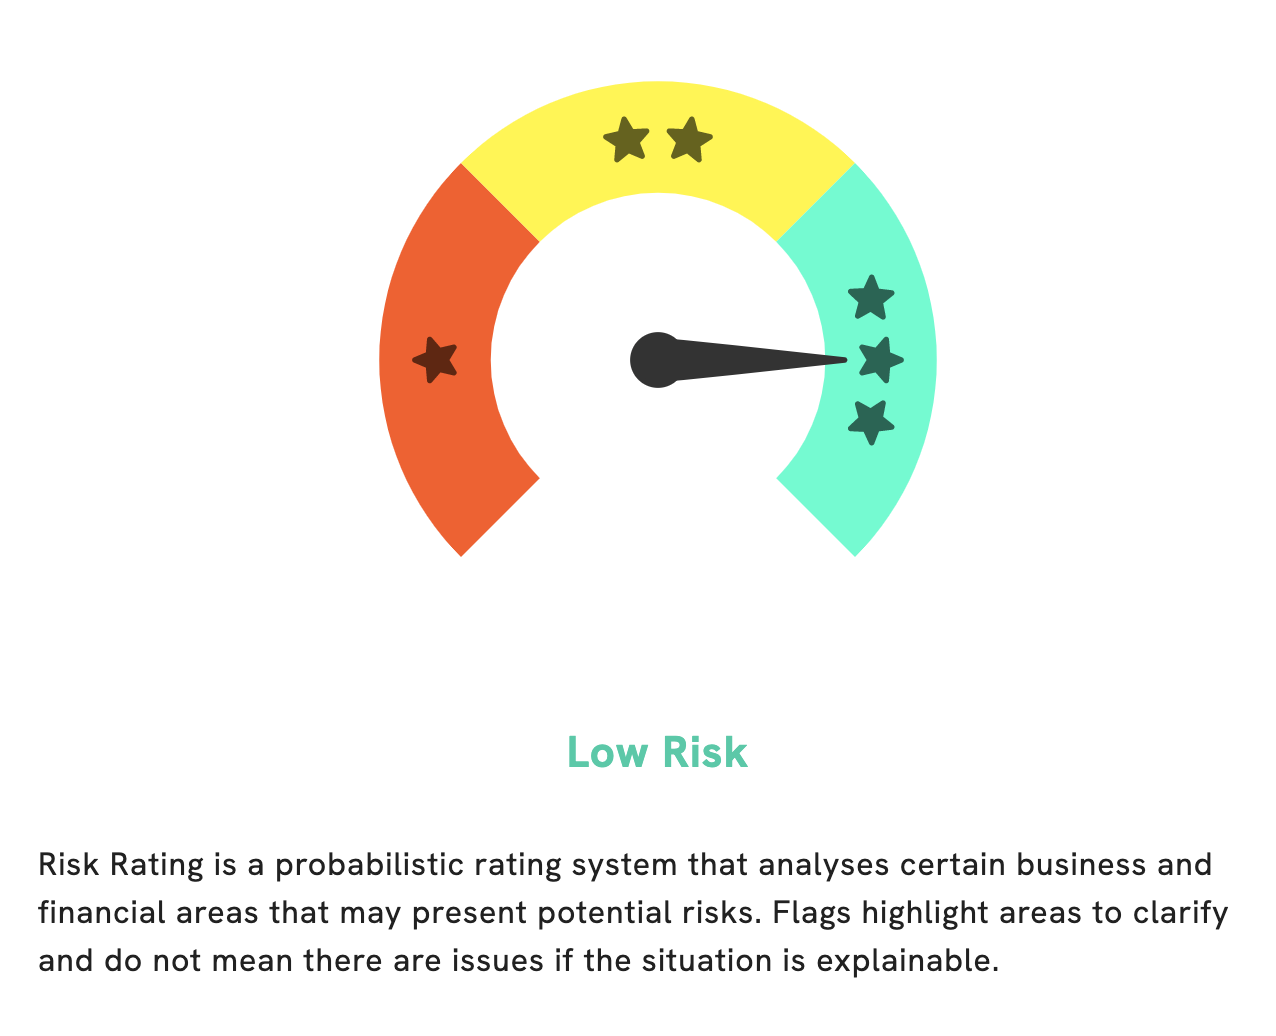
At GoodWhale, we recently performed an analysis of GRACO INC‘s wellbeing. The results display a low risk investment in terms of financial and business aspects. We have noticed one particular risk warnings in the income sheet which can be further explored by becoming a registered user. It is our goal to provide our users with a comprehensive assessment of all potential investments in order to guide their decisions. As such, we hope that our services will be of value to GRACO INC and its investors. More…
Peers
The company’s products include pumps, valves, proportioners, injectors, and DispenseMate systems. Graco’s competitors include Nordson Corp, Manitou BF SA, and Crane Co.
– Nordson Corp ($NASDAQ:NDSN)
Nordson Corp is a market leader in providing technology-based solutions for industrial and consumer markets worldwide. The company has a market cap of 12.1B as of 2022 and a Return on Equity of 18.05%. Nordson provides a broad range of products and solutions for adhesives, coatings, sealants, and other materials processing applications. The company’s products are used in a variety of industries, including automotive, aerospace, electronics, medical devices, and consumer goods. Nordson has a strong global presence, with over 60 manufacturing facilities and sales and service offices in more than 30 countries.
– Manitou BF SA ($LTS:0NDA)
Manitou BF SA is a French company that manufactures and markets construction equipment. The company has a market cap of 769.05M as of 2022 and a Return on Equity of 7.65%. Manitou BF SA’s products include excavators, loaders, and backhoes. The company sells its products through a network of dealers and distributors in Europe, North America, South America, Asia, and Africa.
– Crane Co ($NYSE:CR)
Crane Co. is a global manufacturer of engineered industrial products. The Company operates in four segments: Fluid Handling, Payment & Merchandising Technologies, Aerospace & Electronics and Engineered Materials. Fluid Handling segment designs, manufactures and markets a broad range of engineered industrial products. Payment & Merchandising Technologies segment provides technology solutions for the self-service retail market. Aerospace & Electronics segment provides critical components and systems for the aerospace and defense industries, and Engineered Materials segment provides highly engineered products for energy markets and other industrial applications. Crane Co. was founded in 1855 and is headquartered in Stamford, Connecticut.
Summary
The company reported Non-GAAP earnings per share of $0.74, $0.12 higher than predicted. This outstanding performance highlights Graco’s commitment to delivering value to its investors and reinforces its position as a leader in the industrial equipment sector.
Related Posts


Recent Posts


Investing Everyone Can Do.
Investing shouldn’t be exclusive to a select few. We believe everyone should have the opportunity to grow their wealth. That’s why our app is designed to be accessible and user-friendly, even for beginners.
