Emeren Group Intrinsic Value Calculation – Emeren Group Misses Earnings and Revenue Expectations
June 2, 2023

🌧️Trending News
Similarly, their revenue of $12.88M was far below the projected figure of $20.99M. This news sent shockwaves throughout the markets, leading to a significant sell-off in Emeren Group ($NYSE:SOL) stock. The company attributed the decline in its earnings and revenue to weaker than expected sales in its Europe and Asia-Pacific markets. The company is now looking to cut costs and better manage its operations in order to turn its business around.
Overall, these disappointing results put a damper on the Emeren Group’s performance, leaving investors with many questions regarding the future of the company. With further cost-cutting measures yet to be implemented, it remains to be seen if the Emeren Group can make a successful recovery in the months ahead.
Earnings
In the earning report of FY2022 Q4 ending December 31 2022, EMEREN GROUP has released disappointing results compared with expectations. The company earned a total revenue of 40.8M USD and a net income of 4.84M USD, representing a 78.8% increase in total revenue and 406.3% decrease in net income compared to the same period last year. The financial performance of EMEREN GROUP has seen a dramatic increase in total revenue over the past 3 years.
Notwithstanding the significant increase in total revenue, EMEREN GROUP’s net income has been far below expectations and well short of what was estimated by analysts. This was further compounded by the 406.3% decrease in net income which further affected overall shareholder confidence and caused the stock price to dip significantly after the earnings release.
About the Company
Income Snapshot
Below shows the total revenue, net income and net margin for Emeren Group. More…
| Total Revenues | Net Income | Net Margin |
| 81.41 | 5.9 | 4.9% |
Cash Flow Snapshot
Below shows the cash from operations, investing and financing for Emeren Group. More…
| Operations | Investing | Financing |
| -35.25 | -37.06 | -70.25 |
Balance Sheet Snapshot
Below shows the total assets, liabilities and book value per share for Emeren Group. More…
| Total Assets | Total Liabilities | Book Value Per Share |
| 500.51 | 100.99 | 5.95 |
Key Ratios Snapshot
Some of the financial key ratios for Emeren Group are shown below. More…
| 3Y Rev Growth | 3Y Operating Profit Growth | Operating Margin |
| -11.9% | 8.1% | 13.8% |
| FCF Margin | ROE | ROA |
| -43.3% | 1.9% | 1.4% |
Price History
On Wednesday, shares of EMEREN GROUP opened at $3.4 and closed at the same price, a drop of 1.5% from the last closing price. The company missed expectations on both earnings and revenue for the quarter, causing investors to become anxious. Analysts had expected the company to post higher earnings than what was reported, causing the company’s stock to take a hit.
Overall, investors were disappointed with EMEREN GROUP’s performance for the quarter, which caused the stock to close lower than it opened. With the company’s earnings and revenue failing to meet expectations, investors are now waiting to see if the company can make up for its weak performance in the coming quarters. Live Quote…
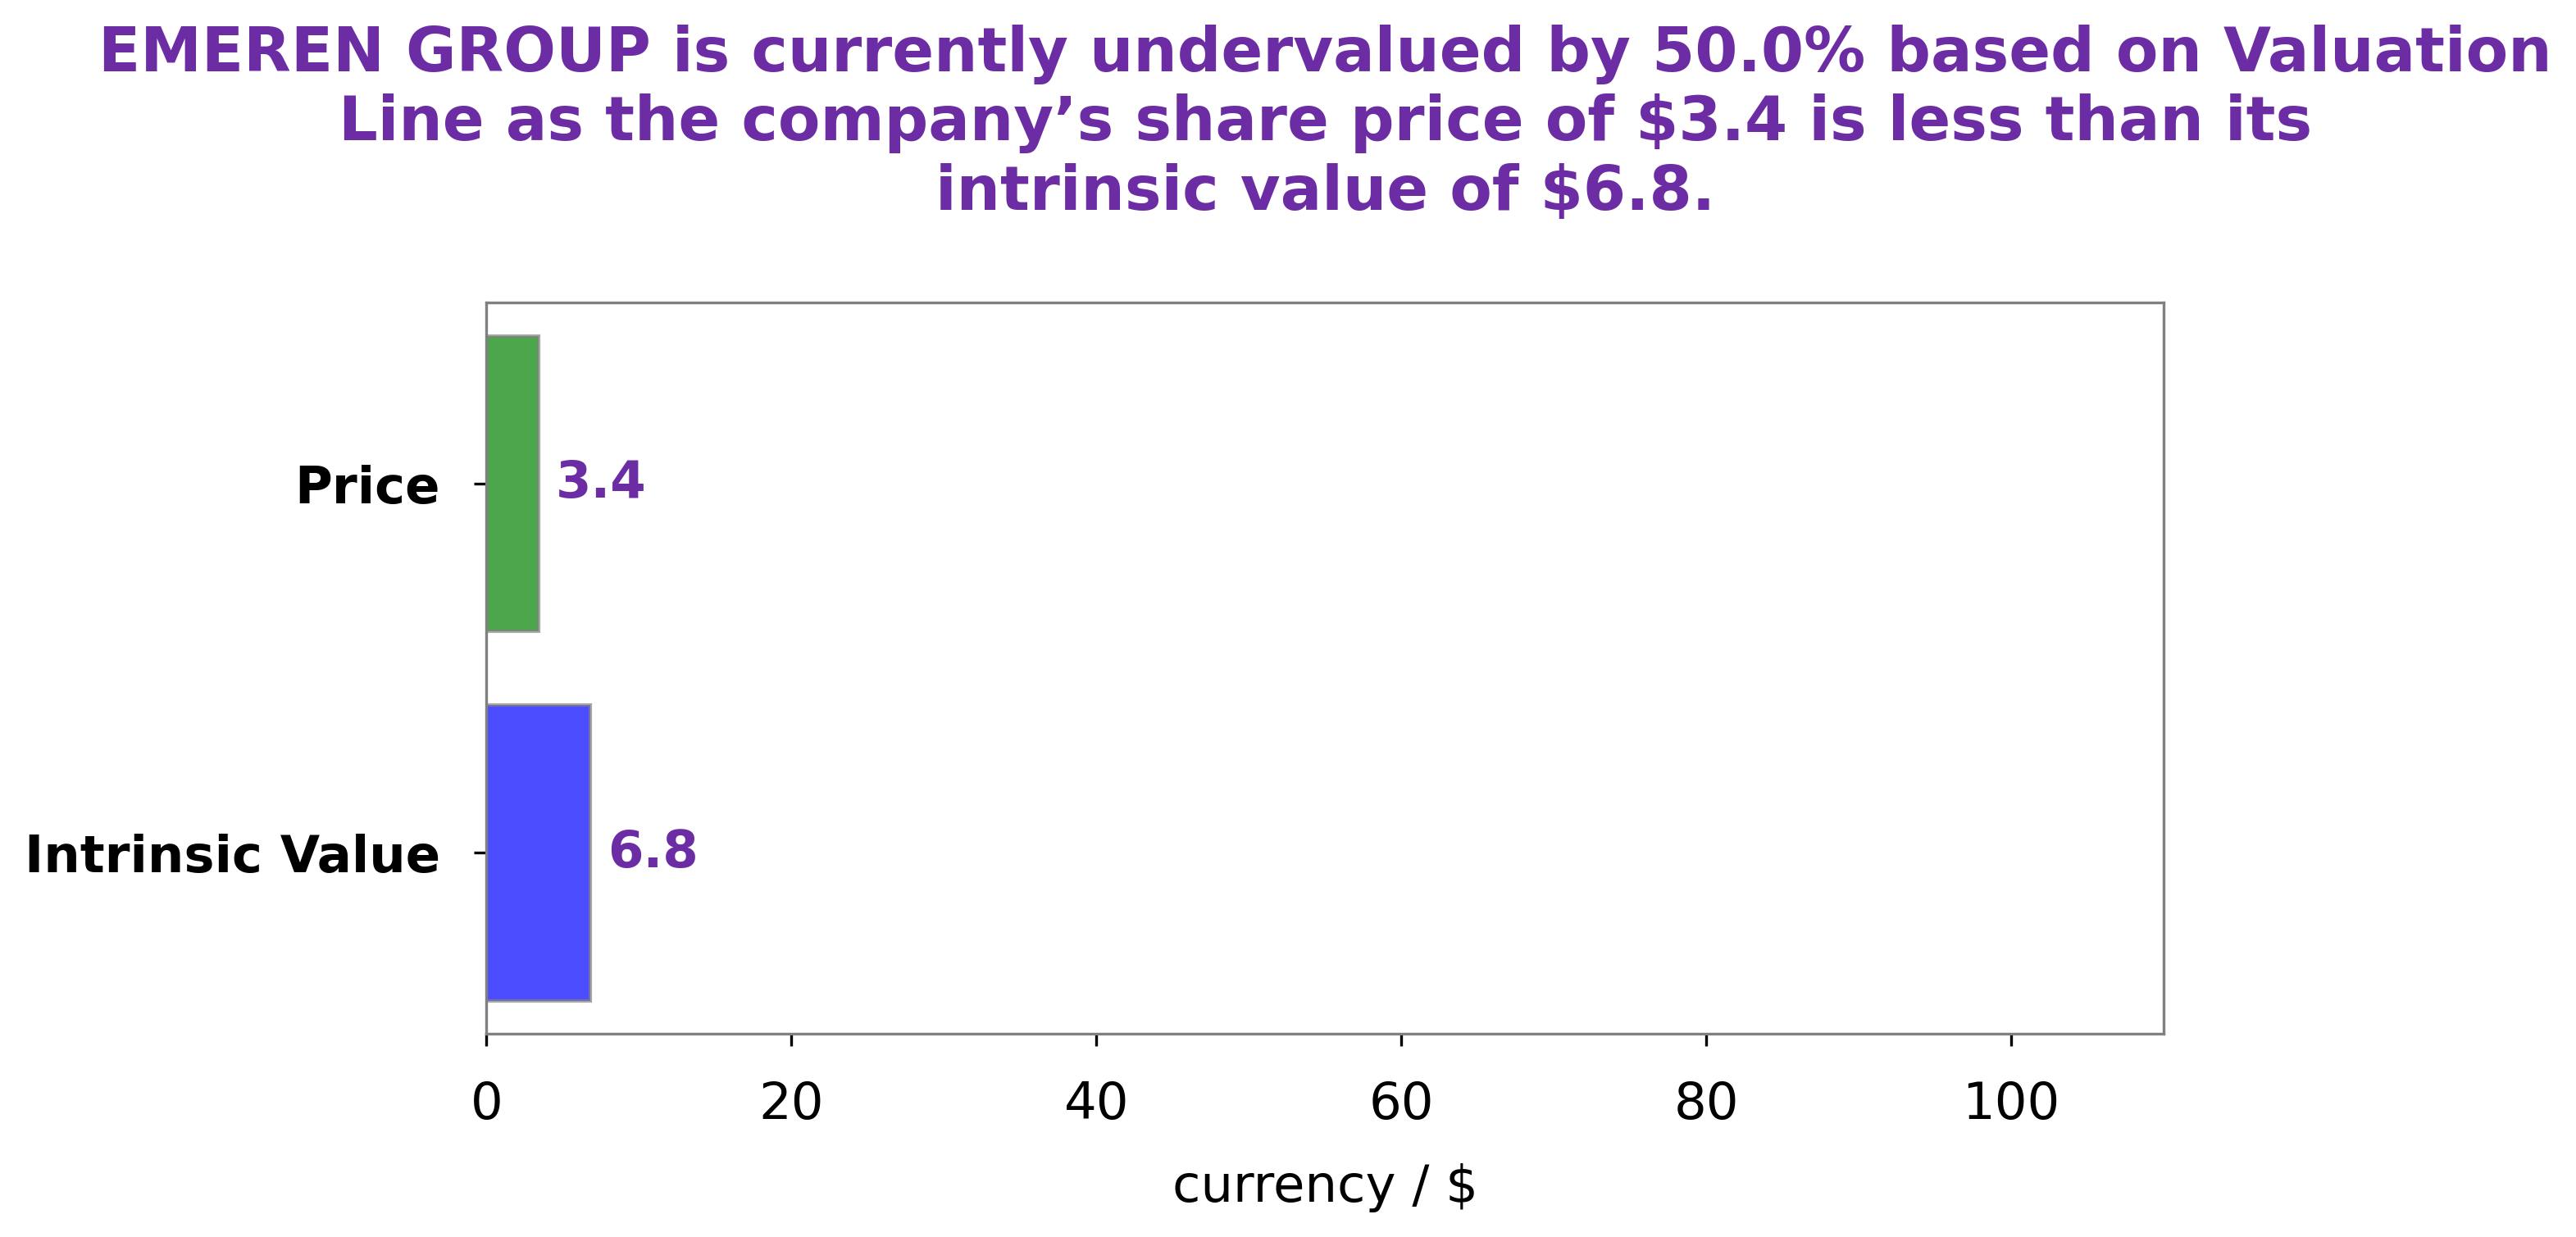
Analysis – Emeren Group Intrinsic Value Calculation
At GoodWhale, we recently completed an analysis of EMEREN GROUP‘s financials. Using our proprietary Valuation Line, we calculated the intrinsic value of an EMEREN GROUP share to be approximately $6.8. Currently, EMEREN GROUP stock is trading at $3.4, representing a 50.3% discount to its true value. We believe this presents a great opportunity for investors and suggest a buy rating for this stock. More…
Peers
ReneSola Ltd, Xinte Energy Co Ltd, SPI Energy Co Ltd, and Solar Alliance Energy Inc are all solar energy companies. Xinte Energy Co Ltd is a Chinese company that manufactures solar cells. SPI Energy Co Ltd is a Hong Kong-based company that manufactures solar cells, modules, and systems. Solar Alliance Energy Inc is a Canadian company that develops, finances, installs, and operates solar projects.
– Xinte Energy Co Ltd ($SEHK:01799)
Xinte Energy Co Ltd is a Chinese state-owned enterprise engaged in the exploration, development, production, and sale of coal and other minerals. As of December 31, 2020, the company had a market capitalization of 23.45 billion yuan. The company’s return on equity was 35.77% as of the same date. Xinte Energy is one of the largest coal producers in China and is also engaged in the production of other minerals such as iron ore, copper, and lead.
– SPI Energy Co Ltd ($NASDAQ:SPI)
SPI Energy Co Ltd, a renewable energy company, engages in the design, development, manufacture, and sale of solar photovoltaic products for residential, commercial, and industrial applications in the People’s Republic of China, the United States, Germany, Japan, South Korea, Singapore, Italy, the United Kingdom, Australia, Switzerland, Spain, and internationally.
– Solar Alliance Energy Inc ($TSXV:SOLR)
Solar Alliance Energy Inc is a Canadian solar energy company that develops, owns, and operates residential and commercial solar installations. The company has a market capitalization of 17.87 million as of 2022 and a return on equity of -297.1%. Solar Alliance Energy Inc has a portfolio of over 1,000 solar installations across Canada and the United States. The company offers solar energy solutions for homeowners, businesses, and government organizations.
Summary
Investing analysis of Emeren Group has shown to be underwhelming. The company reported their GAAP EPADS at $0.00, missing analyst expectations by $0.06.
Additionally, their reported revenue of $12.88M fell short of estimates by $20.99M. This has caused analyst to lower their outlook on the company and question the stability of its financials going forward. Investors should be aware of the risks associated with investing in Emeren Group due to their underperformance on key financial metrics.


Investing Everyone Can Do.
Investing shouldn’t be exclusive to a select few. We believe everyone should have the opportunity to grow their wealth. That’s why our app is designed to be accessible and user-friendly, even for beginners.
