LYFT Making Progress, But Still Behind Uber
December 8, 2023

☀️Trending News
However, it is still behind rival company Uber according to many metrics. Despite this, LYFT ($NASDAQ:LYFT) is making strides and has become a serious contender in the industry. The company has also made investments in autonomous driving technology, and is now offering rides in self-driving cars in certain cities.
Additionally, LYFT has entered into partnerships with McDonalds, Taco Bell, and other large companies to offer discounted rides. Despite these successes, LYFT still lags behind Uber. Additionally, Uber has significantly more drivers than LYFT, giving it a distinct advantage when it comes to availability. Though it is still behind Uber, LYFT is making progress and showing that it can compete in the industry. It has become a viable option for many people who are looking for rideshare services and is continuing to make strides. As the two companies compete for market share, only time will tell if LYFT can eventually overtake Uber as the top ride sharing company.
Market Price
Thursday saw LYFT make steady progress, with its opening stock price of $12.4 closing at the same amount, up 1.8% from the prior closing price of 12.2. This demonstrates that there is still some way to go for LYFT to catch up to Uber’s growth and success. lyft&utm_title=LYFT_Making_Progress_But_Still_Behind_Uber”>Live Quote…
About the Company
Income Snapshot
Below shows the total revenue, net income and net margin for Lyft. More…
| Total Revenues | Net Income | Net Margin |
| 4.35k | -902.14 | -20.8% |
Cash Flow Snapshot
Below shows the cash from operations, investing and financing for Lyft. More…
| Operations | Investing | Financing |
| -175.31 | 840.31 | -126.69 |
Balance Sheet Snapshot
Below shows the total assets, liabilities and book value per share for Lyft. More…
| Total Assets | Total Liabilities | Book Value Per Share |
| 4.48k | 4.01k | 1.19 |
Key Ratios Snapshot
Some of the financial key ratios for Lyft are shown below. More…
| 3Y Rev Growth | 3Y Operating Profit Growth | Operating Margin |
| 15.7% | – | -20.0% |
| FCF Margin | ROE | ROA |
| -7.6% | -127.3% | -12.2% |
Analysis
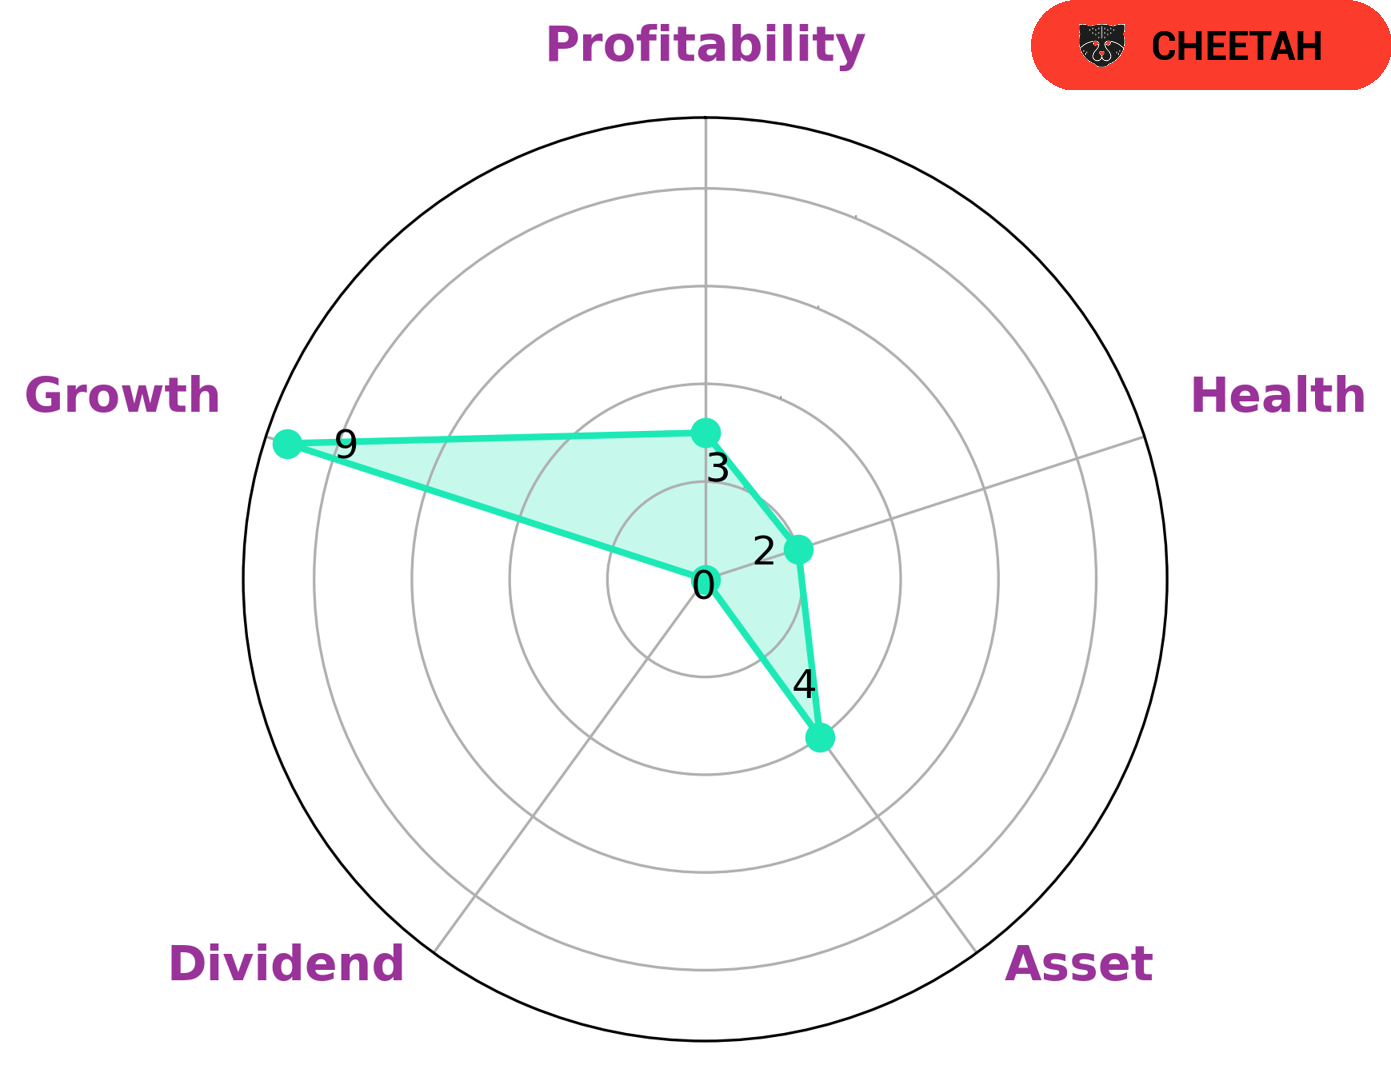
We conducted an analysis of LYFT’s wellbeing, and the Star Chart revealed a low health score of 2/10. This indicates that the company is less likely to be able to pay off its debt and fund future operations with its current cashflows and debt. LYFT is strong in growth, medium in assets, and weak in dividends and profitability. This type of company is classified as a ‘cheetah’, which we conclude achieved high revenue or earnings growth but is considered less stable due to lower profitability. Investors who are looking for high growth companies with potential capital appreciation may be drawn to a cheetah like LYFT. However, these investors should be aware of the risks associated with a company with lower profitability and be prepared to take on more volatility. As always, we recommend conducting thorough research into any investment before committing funds. lyft&utm_title=LYFT_Making_Progress_But_Still_Behind_Uber”>More…
Peers
The competition among Lyft Inc, Forge Global Holdings Inc, SK Hynix Inc, and CE Info Systems Ltd is fierce. All four companies are vying for a share of the market, and each has its own strengths and weaknesses. Lyft Inc is a relative newcomer to the market, but it has quickly established itself as a major player. Forge Global Holdings Inc is a large company with a long history in the industry. SK Hynix Inc is a smaller company, but it has a strong reputation for quality. CE Info Systems Ltd is a small company, but it has a very innovative product.
– Forge Global Holdings Inc ($NYSE:FRGE)
Founded in 2001, Forge Global Holdings Inc is a provider of investment banking and capital markets services. The company has a market cap of 301.72M as of 2022 and a Return on Equity of -4.23%. The company offers a range of services, including mergers and acquisitions, public and private placement of debt and equity securities, and advising on restructurings and other corporate finance matters.
– SK Hynix Inc ($KOSE:000660)
SK Hynix is a South Korean semiconductor company that produces dynamic random-access memory (DRAM) chips and flash memory chips. SK Hynix is the world’s second-largest memory chipmaker after Samsung Electronics. The company has a market capitalization of US$65.46 billion as of March 2021.
SK Hynix was founded in 1983 as a joint venture between Hyundai Electronics and Samsung Electronics. The company’s main manufacturing facility is located in Icheon, South Korea. SK Hynix also has fabrication plants in China, the United States, and Taiwan.
The company’s products are used in a variety of electronic devices, including personal computers, servers, mobile devices, and digital cameras. SK Hynix is a major supplier of DRAM chips to companies such as Apple, Samsung, and Dell.
SK Hynix reported a 15.68% return on equity for the year ended December 31, 2020.
– CE Info Systems Ltd ($BSE:543425)
HCL Technologies Ltd, a leading global technology company, has a market cap of $70.19 billion as of March 2022. The company’s return on equity (ROE) is 18.0%. HCL Technologies is a provider of IT services, including digital, technology, consulting, and operations services. The company has a strong presence in India, the United States, Europe, and Asia Pacific.
Summary
Lyft has become one of the most popular ride-sharing services, but its valuation has yet to catch up to its larger rival Uber. Analysts suggest this is due to slower revenue growth, higher competition, and less profitability. Despite these challenges, Lyft’s stock price has been rising steadily with the company’s increased focus on profitability and cost control.
Lyft is also implementing strategic initiatives such as its subscription service and investments in autonomous driving technology. With the current investment momentum, the company’s future looks promising and investors are cautiously optimistic about its long-term potential.
Related Posts


Recent Posts


Investing Everyone Can Do.
Investing shouldn’t be exclusive to a select few. We believe everyone should have the opportunity to grow their wealth. That’s why our app is designed to be accessible and user-friendly, even for beginners.
