Thor Industries Posts Surprising Earnings and Revenue Growth
June 12, 2023

☀️Trending News
Thor Industries ($NYSE:THO) has posted surprisingly strong earnings and revenue growth for the past quarter. The company’s GAAP Earnings Per Share (EPS) of $2.24 exceeded expectations by $1.12, while its revenue of $2.93 billion came in higher than expected by $110 million. Thor Industries is a leading manufacturer of recreational vehicles in the United States and is listed on the New York Stock Exchange. It manufactures a wide variety of recreational vehicles including fifth-wheels, travel trailers, truck campers, motorhomes and camping trailers. In addition to RVs, they also offer parts and accessories, service and repairs.
This impressive financial performance indicates that Thor is well-positioned to capitalize on strong consumer demand in the RV industry. The company’s sales have grown significantly over the past year, as consumers have been drawn to its superior products and services. Thor has also been successful in expanding its market share, as it has opened new retail stores and distribution centers in key markets. Going forward, investors can expect continued strong growth from Thor Industries as it continues to deliver on its mission to be the leader in the RV industry.
Earnings
The company earned a total revenue of 2727.79M USD, earning 132.52M USD in net income. Both figures saw a decrease from the previous year’s results, with a 29.6% decrease in total revenue and 50.3% decrease in net income. However, compared to the previous three years, total revenue had been increasing steadily from 2346.64M USD, proving that Thor Industries is weathering the market fluctuations successfully. Although Thor Industries saw a decline in overall profits this quarter, it is clear that the company is still in a strong position to remain competitive in the industry.
About the Company
Income Snapshot
Below shows the total revenue, net income and net margin for Thor Industries. More…
| Total Revenues | Net Income | Net Margin |
| 12.21k | 564.93 | 4.6% |
Cash Flow Snapshot
Below shows the cash from operations, investing and financing for Thor Industries. More…
| Operations | Investing | Financing |
| 826.82 | -248.97 | -564.36 |
Balance Sheet Snapshot
Below shows the total assets, liabilities and book value per share for Thor Industries. More…
| Total Assets | Total Liabilities | Book Value Per Share |
| 7.55k | 3.66k | 73.01 |
Key Ratios Snapshot
Some of the financial key ratios for Thor Industries are shown below. More…
| 3Y Rev Growth | 3Y Operating Profit Growth | Operating Margin |
| 14.4% | 30.8% | 6.6% |
| FCF Margin | ROE | ROA |
| 5.0% | 13.1% | 6.7% |
Market Price
On Tuesday, Thor Industries experienced an unexpected surge of success on the stock market. The stock opened at $88.0 and closed at a staggering $93.2, representing a 17.7% increase from the prior closing price of 79.2. Investors are looking to Thor Industries as a reliable and secure stock choice in an unpredictable market. Thor Industries is the world’s largest RV manufacturer and has a history of providing high-quality recreational vehicles.
The company offers a wide lineup of products from travel trailers to luxury motorhomes. With their recent success in the stock market, Thor Industries may be poised for continued success in the coming months. Live Quote…
Analysis
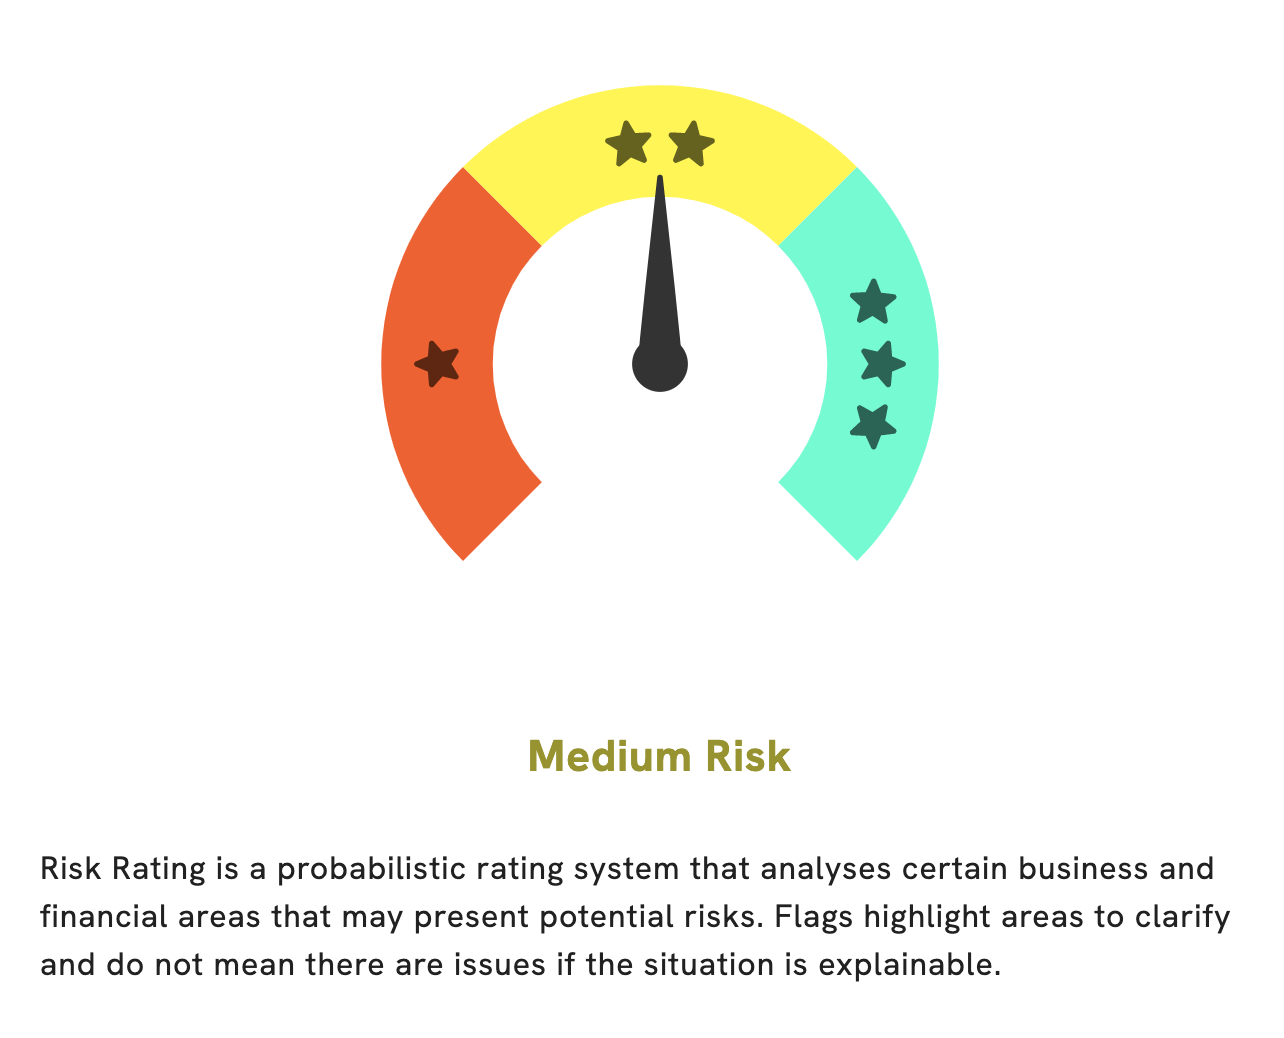
At GoodWhale, we have undertaken an in-depth analysis of THOR INDUSTRIES’ fundamentals and present our findings below. According to our Risk Rating analysis, THOR INDUSTRIES is a medium risk investment in terms of financial and business aspects. We have identified potential risks in both of these areas, so it is important to do further research before making an investment. For more information on the financial and business aspects of THOR INDUSTRIES, sign up for a free account with GoodWhale. Our easy-to-use platform provides all the necessary tools to assess potential risks and maximize returns. With GoodWhale, you can monitor THOR INDUSTRIES’s performance and make informed investment decisions for the long term. More…
Peers
Thor Industries Inc is one of the leading manufacturers of recreational vehicles in the world. Its main competitors are Polaris Inc, PIERER Mobility AG, and Mazda Motor Corp. All three companies are well-known for their innovative products and cutting-edge technology.
– Polaris Inc ($NYSE:PII)
Polaris Inc is a global leader in the design and manufacture of off-road vehicles, snowmobiles, ATVs, and motorcycles. With a market cap of 6.29B as of 2022 and a Return on Equity of 40.34%, Polaris Inc is a well-established company with a strong financial foundation. Polaris Inc’s products are available in over 150 countries, and the company has a presence in some of the most remote and challenging environments on earth. From its humble beginnings in Minnesota in 1954, Polaris Inc has grown into a global powerhouse, driven by a passion for innovation and a commitment to quality and customer satisfaction.
– PIERER Mobility AG ($BER:PMAG)
Porsche is a German automaker that specializes in high-performance sports cars, SUVs, and sedans. The company has a market cap of $2.22 billion and a return on equity of 15.36%. Porsche is headquartered in Stuttgart, Germany, and has a history that dates back to 1931. The company’s products are sold in over 100 countries around the world.
– Mazda Motor Corp ($TSE:7261)
Mazda Motor Corporation is a Japanese multinational automaker based in Fuchū, Aki District, Hiroshima Prefecture, Japan. In 2015, Mazda produced 1.5 million vehicles for global sales, the majority of which (nearly 1 million) were produced in the company’s Japanese plants, with the remainder coming from a variety of other plants worldwide.
Summary
The company reported an EPS of $2.24, a positive surprise of $1.12 compared to the analysts’ estimates. Revenue for the quarter was $2.93 billion, beating the estimated figure by $110 million. This positive news resulted in a surge in Thor Industries‘ stock price the same day. Investing analysts are optimistic about Thor’s outlook going forward as the company shows strong performance and is well-positioned to benefit from various cyclical drivers in the leisure vehicle market.
Related Posts


Recent Posts


Investing Everyone Can Do.
Investing shouldn’t be exclusive to a select few. We believe everyone should have the opportunity to grow their wealth. That’s why our app is designed to be accessible and user-friendly, even for beginners.
