General Mills Reports $1.25 Non-GAAP EPS, Revenue of $5.1B Misses by $260M
December 22, 2023

🌧️Trending News
The company recently reported its non-GAAP earnings per share (EPS) of $1.25, meeting analyst expectations and exceeding its previous guidance by $0.09. While the reported EPS was strong, investors remain concerned about the company’s sluggish sales growth. In the past two quarters, General Mills ($NYSE:GIS) has posted declines in revenue, due in part to its exposure to shifting consumer preferences and a challenging retail environment.
In addition, the company is contending with rising commodity costs and currency headwinds that have cut into its profitability. General Mills is attempting to adjust to the changing environment by reducing costs, launching new products, and investing in its brands. Nevertheless, the company has downgraded its guidance for the current fiscal year, citing continued soft market trends. Investors will be watching to see if General Mills can continue to meet or exceed its earnings expectations in the coming quarters.
Earnings
General Mills, a leading consumer food products company, reported its earnings for fiscal year Q2 2021.
About the Company
Income Snapshot
Below shows the total revenue, net income and net margin for General Mills. More…
| Total Revenues | Net Income | Net Margin |
| 20.2k | 2.44k | 12.7% |
Cash Flow Snapshot
Below shows the cash from operations, investing and financing for General Mills. More…
| Operations | Investing | Financing |
| 3.07k | -787.7 | -2.35k |
Balance Sheet Snapshot
Below shows the total assets, liabilities and book value per share for General Mills. More…
| Total Assets | Total Liabilities | Book Value Per Share |
| 31.23k | 21.6k | 16.13 |
Key Ratios Snapshot
Some of the financial key ratios for General Mills are shown below. More…
| 3Y Rev Growth | 3Y Operating Profit Growth | Operating Margin |
| 3.4% | 1.8% | 19.5% |
| FCF Margin | ROE | ROA |
| 11.5% | 25.0% | 7.9% |
Market Price
On Wednesday, General Mills reported a non-GAAP earnings per share of $1.25 and revenue of $5.1B, missing estimates by $260M. The company’s stock opened at $64.0 and closed at $64.3, down 3.6% from the previous closing price of 66.7. The decrease in stock prices reflects the negative response to the results from analysts and investors alike who were expecting higher numbers. Live Quote…
Analysis
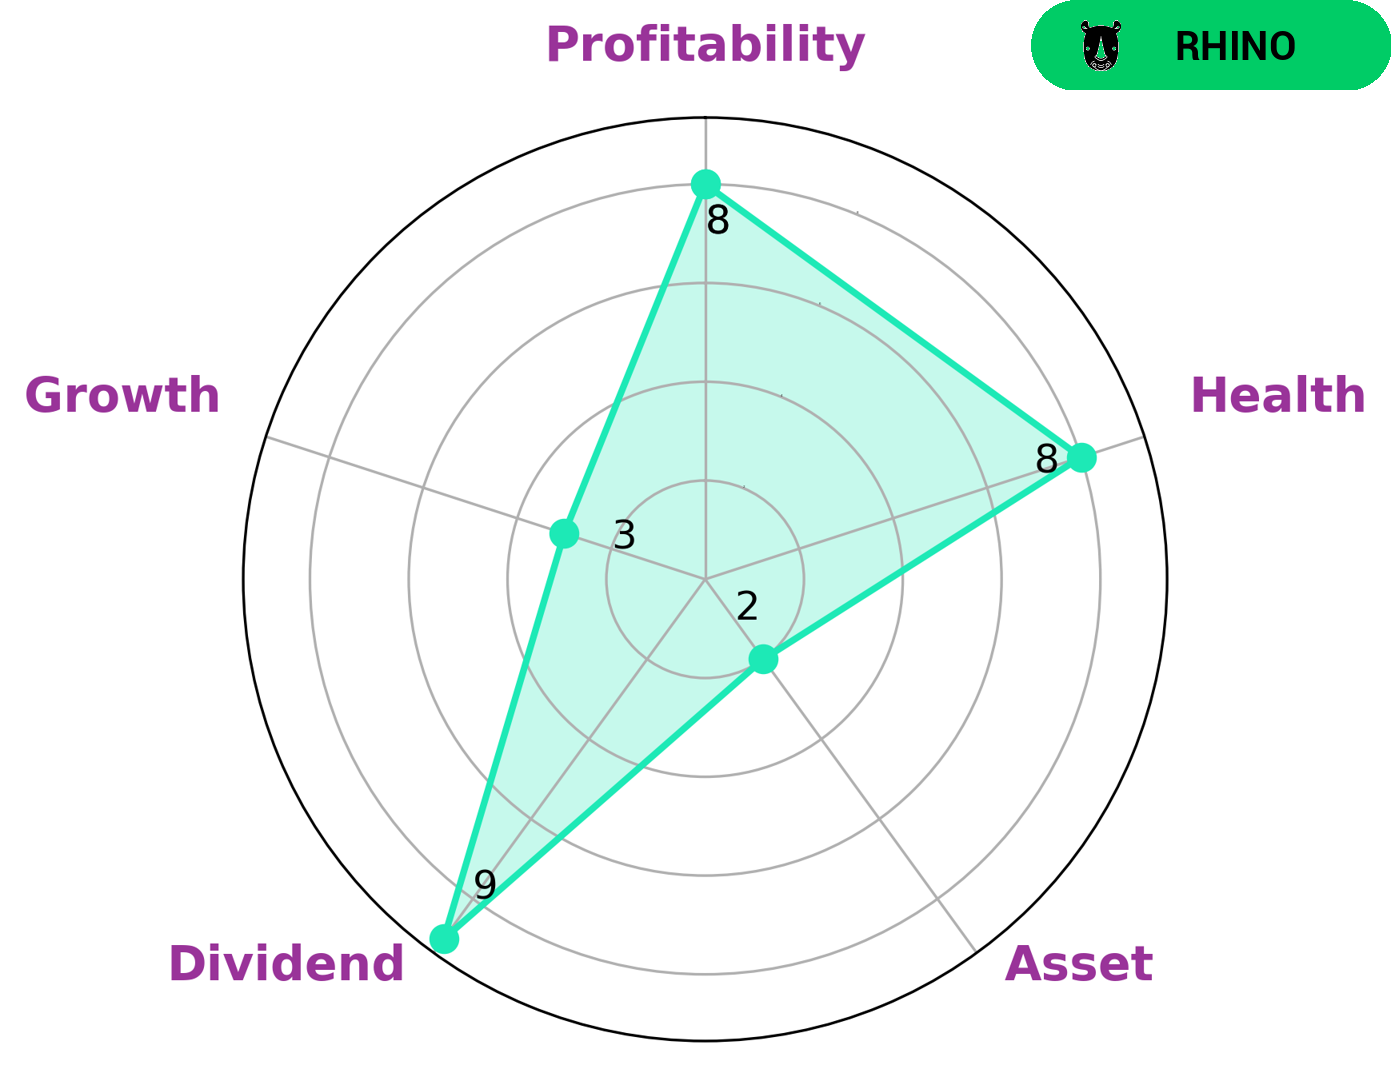
At GoodWhale, we have taken a close look at GENERAL MILLS to better understand the company’s wellbeing. According to our Star Chart, GENERAL MILLS is strong in dividend and profitability, but weak in asset and growth. We have classified GENERAL MILLS as ‘rhino’, indicating that the company has achieved moderate revenue or earnings growth. Given this information, investors who are looking for steady returns and reliable growth may be interested in GENERAL MILLS as an option. Additionally, our analysis reveals that GENERAL MILLS has a high health score of 8/10 with regard to its cashflows and debt, suggesting that it is capable of sustaining future operations in times of crisis. More…
Peers
JM Smucker Co, Newberry Specialty Bakers Inc, and J&J Snack Foods Corp are all companies that compete with General Mills Inc.
– JM Smucker Co ($NYSE:SJM)
The J.M. Smucker Company has a market capitalization of $14.97 billion as of 2022 and a return on equity of 7.19%. The company manufactures and markets food and beverage products, including coffee, peanut butter, shortening and oils, frozen sandwiches, fruit spreads, syrups, and toppings. It also produces pet food, pet snacks, and pet food ingredients. The company was founded in 1897 and is headquartered in Orrville, Ohio.
– Newberry Specialty Bakers Inc ($OTCPK:NBRY)
J&J Snack Foods Corp is a leading manufacturer and distributor of snack foods and beverages. The company’s products include pretzels, chips, popcorn, frozen desserts, and more. J&J Snack Foods Corp has a strong presence in the United States and internationally. The company’s products are sold in over 100 countries. J&J Snack Foods Corp is a publicly traded company on the NASDAQ stock exchange. The company’s stock ticker symbol is JJSF. J&J Snack Foods Corp was founded in 1971 and is headquartered in Pennsauken, New Jersey.
Summary
General Mills is a multinational food production company. Its recently released non-GAAP EPS of $1.25 beat analyst estimates by $0.09, but its revenue of $5.1B missed expectations by $260M. The markets reacted negatively to the report, as the stock price moved down the same day.
Investors should take caution when considering General Mills as a potential investment, as the company may still be struggling to meet revenue targets in the future. Furthermore, investors should also keep an eye on the company’s financials and performance going forward, to ensure that General Mills remains a viable investment option.
Related Posts


Recent Posts


Investing Everyone Can Do.
Investing shouldn’t be exclusive to a select few. We believe everyone should have the opportunity to grow their wealth. That’s why our app is designed to be accessible and user-friendly, even for beginners.
