Haynes International Shares Soar Above 200 Day Moving Average
April 15, 2023

Trending News ☀️
Haynes International ($NASDAQ:HAYN), Inc. is a leading global manufacturer of high-performance alloys for high-temperature and corrosion resistance applications. This marks the first time the stock crossed this important level since May of last year. The news of Haynes International shares surpassing the 200-day moving average has been welcomed by investors, with the stock gaining more than 3% in value. Analysts see this as a positive sign for the company’s long-term prospects, as it indicates that there is confidence in the company’s future performance.
Analysts also note that Haynes International has recently undertaken several strategic initiatives that have put the company in a better position to capitalize on its potential for long-term growth. For investors looking for long-term value, Haynes International may be an attractive option. With the stock now trading above its 200-day moving average, investors can take comfort in knowing that their investments are backed by a company that has a positive outlook for the future.
Market Price
On Friday, shares of HAYNES INTERNATIONAL showed impressive strength as they rose above their 200 day moving average. The stock opened at $49.2 and closed at $48.4, down by 1.2% from its last closing price of $49.0. This marks the first time in recent weeks that HAYNES INTERNATIONAL has broken above its 200 day moving average, which indicates that the stock is on an upward trajectory. Analysts are upbeat about the stock’s performance, and are predicting more upside in the near future. Live Quote…
About the Company
Income Snapshot
Below shows the total revenue, net income and net margin for Haynes International. More…
| Total Revenues | Net Income | Net Margin |
| 523.7 | 47.73 | 9.2% |
Cash Flow Snapshot
Below shows the cash from operations, investing and financing for Haynes International. More…
| Operations | Investing | Financing |
| -62.75 | -15.1 | 75.65 |
Balance Sheet Snapshot
Below shows the total assets, liabilities and book value per share for Haynes International. More…
| Total Assets | Total Liabilities | Book Value Per Share |
| 665.8 | 276.66 | 30.84 |
Key Ratios Snapshot
Some of the financial key ratios for Haynes International are shown below. More…
| 3Y Rev Growth | 3Y Operating Profit Growth | Operating Margin |
| 2.1% | 38.5% | 12.4% |
| FCF Margin | ROE | ROA |
| -14.9% | 10.6% | 6.1% |
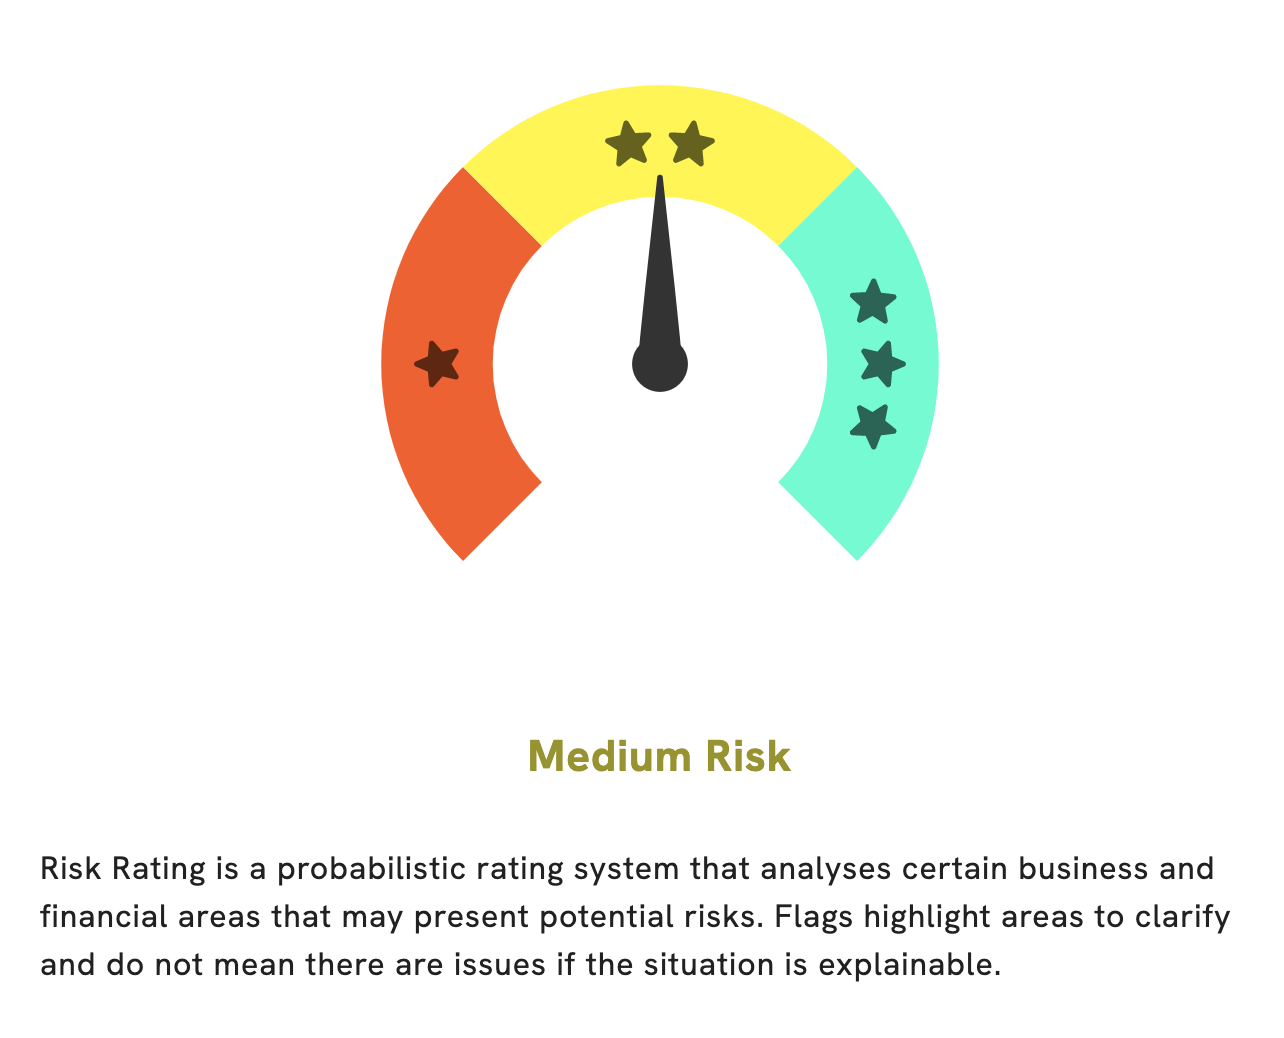
Analysis
At GoodWhale, we’ve conducted an analysis of HAYNES INTERNATIONAL‘s fundamentals. Our Risk Rating indicates that HAYNES INTERNATIONAL is a medium risk investment in terms of financial and business aspects. We’ve also detected 3 risk warnings in the income sheet, balance sheet, and financial journal. To view further details on these risk warnings, be sure to register with us and take a closer look at the analysis. By registering with us, you’ll gain access to our comprehensive analysis, so you can make the best decisions for your investments. With GoodWhale’s help, you can feel confident that your investments are backed by solid research. More…
Peers
The company’s alloys are used in a variety of industries, including aerospace, chemical processing, and power generation. Haynes International‘s main competitors are Allegheny Technologies Inc, Thermodynetics Inc, HydrogenPro AS.
– Allegheny Technologies Inc ($NYSE:ATI)
Allegheny Technologies Inc is a specialty metals company with a market cap of 3.88B as of 2022. They have a Return on Equity of 13.59%. The company produces and sells a variety of specialty metals and alloys, including stainless steel, titanium, and nickel-based alloys. They serve a wide range of industries, including aerospace, chemical processing, oil and gas, and power generation.
– Thermodynetics Inc ($OTCPK:TDYT)
Thermodynetics Inc is a company that manufactures and sells heat exchangers and related products. The company has a market capitalization of 97.5 million and a return on equity of 831.89%. The company’s products are used in a variety of industries, including automotive, aerospace, and chemical processing. Thermodynetics has a strong market presence and is a leading supplier of heat exchangers in North America. The company’s products are backed by a team of experienced engineers and a quality management system that is ISO 9001:2008 certified.
– HydrogenPro AS ($OTCPK:HYPRF)
Hydrogen Pro AS has a market cap of 186.33M as of 2022. It is a Return on Equity of -9.52%. The company produces hydrogen fuel cells and related technologies. Its products are used in a variety of applications, including transportation, stationary power, and portable power.
Summary
Investors may be encouraged that Haynes International, Inc. has crossed above its 200-day moving average of $49.16. This technical indicator is often used to measure the long-term trend of a stock, and crossing above this level may signal a positive outlook in the future. Analysts may also analyze the company’s financial performance and market capitalization to determine whether it is undervalued or overvalued.
They can also review the industry trends, competitive landscape, and demand for the company’s products or services in order to gain a better understanding of its potential. Investors should also consider other potential risks, such as management changes, financial or regulatory issues, or related macroeconomic conditions before investing in Haynes International, Inc.


Investing Everyone Can Do.
Investing shouldn’t be exclusive to a select few. We believe everyone should have the opportunity to grow their wealth. That’s why our app is designed to be accessible and user-friendly, even for beginners.
