Kadant Inc Intrinsic Value Calculator – Kadant Soars with Strong Technical Momentum, Earns Top Spot on Watch List with 80+ RS Rating
September 11, 2024

☀️Trending News
Kadant Inc ($NYSE:KAI). is a global supplier of high-performance products and systems used in various industries including papermaking, packaging, and fiber-based products. The company has a strong presence in both domestic and international markets, with operations in North America, Europe, and Asia. Recently, Kadant Inc. has been making headlines with its impressive technical momentum. The company’s stock has been soaring, attracting the attention of investors and earning a top spot on watch lists. This is due in part to the company’s renewed technical strength as stocks make a comeback. One key factor that investors should consider when creating a watch list is the Relative Strength (RS) Rating. Stocks with an RS Rating of 80 or above are considered to have strong technical momentum and are highly sought after by investors. Kadant Inc. has recently achieved this benchmark, making it a prime example of a stock with strong technical strength. With an RS Rating of 80+, the company has shown consistent and impressive performance over the past year.
This is a testament to the company’s strong financials and growth potential, making it an attractive investment opportunity. In addition to its strong RS Rating, Kadant Inc. also boasts a solid track record of financial success. The company has consistently reported strong earnings growth over the past few years, indicating its stability and resilience even in challenging market conditions. Furthermore, Kadant Inc. has a diversified portfolio of products and services, catering to a variety of industries. This not only allows the company to mitigate risks but also positions it for future growth opportunities in emerging markets. In conclusion, Kadant Inc.’s recent surge in technical momentum and impressive RS Rating make it a top contender for investors looking for strong and stable companies to add to their watch list. With its strong financials, diverse portfolio, and global presence, Kadant Inc. is well-positioned for continued growth and success in the market.
Share Price
On Monday, the company’s stock opened at $301.34 and closed at $303.17, showing a 0.68% increase from its previous closing price of $301.11. This jump in stock price can be attributed to the company’s robust technical performance, which has caught the attention of investors and analysts alike. This indicates that the stock has been outperforming a majority of other stocks in terms of price movement. The company’s success can also be attributed to its strong financials and steady growth. Kadant Inc. has been consistently reporting strong earnings and revenue growth, which has boosted investor confidence and contributed to its rise in stock price. Furthermore, Kadant Inc. has a diversified business portfolio, providing products and services to various industries such as paper and packaging, wood processing, biotech, and more. This diversification has helped the company weather any potential industry-specific challenges and maintain steady growth.
Investors are also keeping an eye on Kadant Inc. as it continues to expand its global presence through strategic partnerships and acquisitions. Recently, the company acquired Syntron Material Handling, LLC, a leading manufacturer of bulk material handling equipment, further strengthening its position in the market. Overall, Kadant Inc.’s strong technical momentum and impressive financial performance make it a top contender for investors looking for growth opportunities in the market. With its consistent track record and strategic initiatives, the company is well-positioned for continued success and is one to watch for potential investors. Live Quote…
About the Company
Income Snapshot
Below shows the total revenue, net income and net margin for Kadant Inc. More…
| Total Revenues | Net Income | Net Margin |
| 957.67 | 116.07 | 12.2% |
Cash Flow Snapshot
Below shows the cash from operations, investing and financing for Kadant Inc. More…
| Operations | Investing | Financing |
| 141.47 | -29.52 | -80.57 |
Balance Sheet Snapshot
Below shows the total assets, liabilities and book value per share for Kadant Inc. More…
| Total Assets | Total Liabilities | Book Value Per Share |
| 1.18k | 399.43 | 62.5 |
Key Ratios Snapshot
Some of the financial key ratios for Kadant Inc are shown below. More…
| 3Y Rev Growth | 3Y Operating Profit Growth | Operating Margin |
| 14.7% | 25.6% | 17.5% |
| FCF Margin | ROE | ROA |
| 11.2% | 14.3% | 8.9% |
Analysis – Kadant Inc Intrinsic Value Calculator
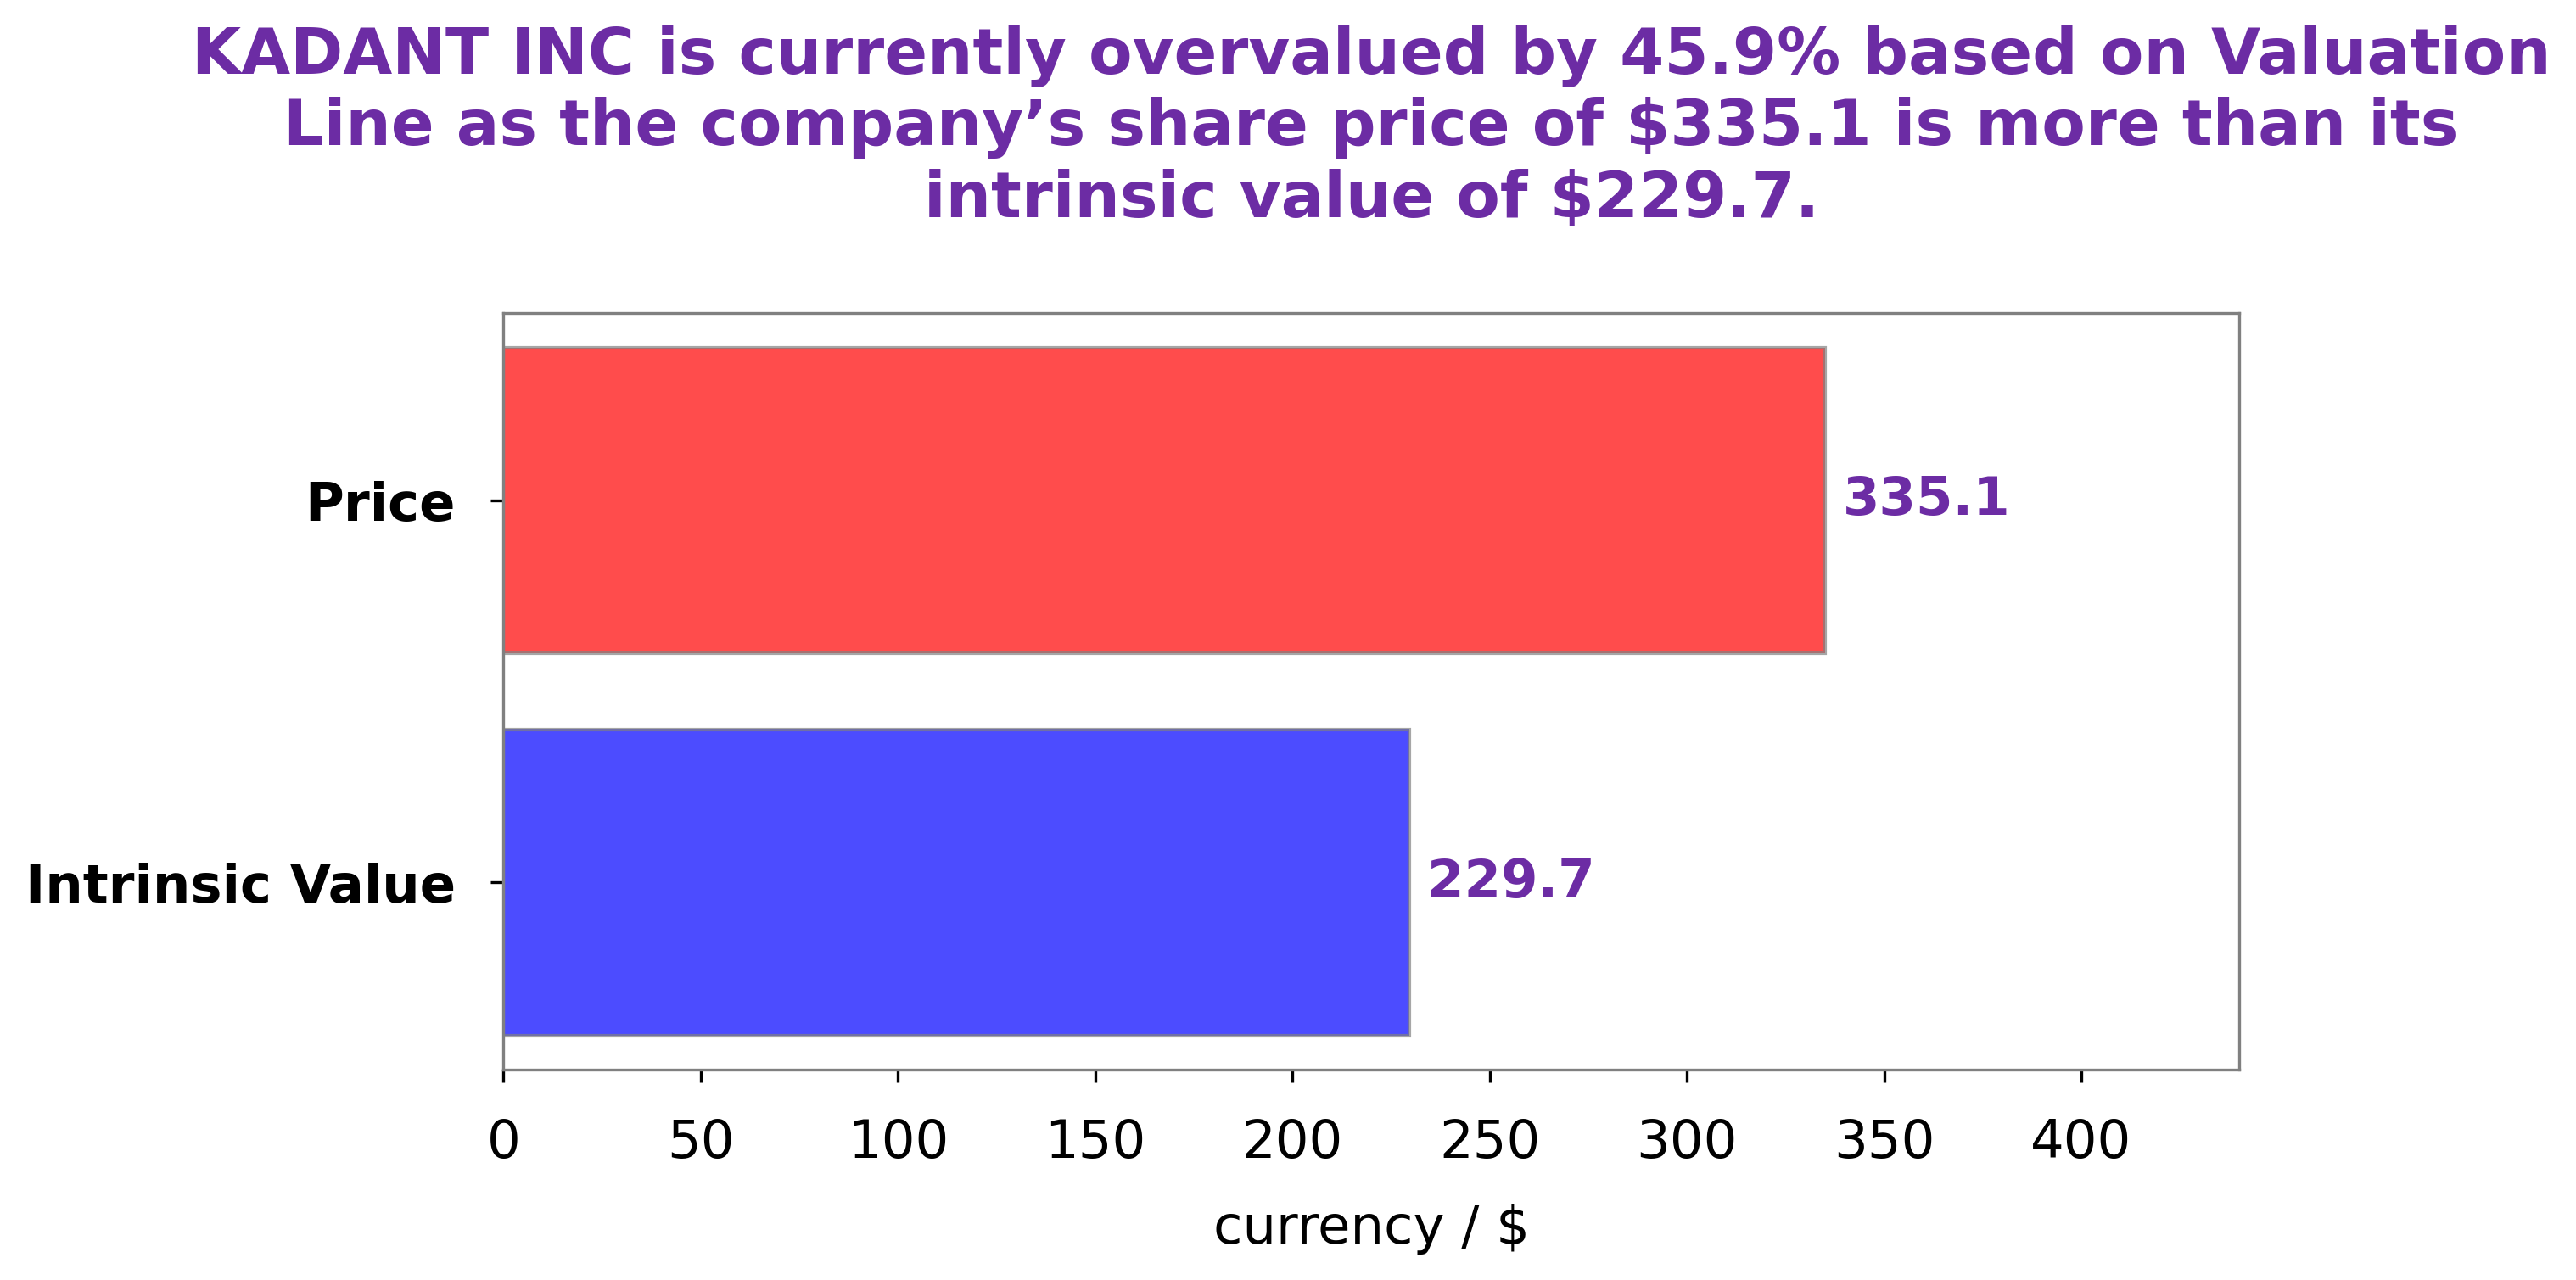
After conducting a thorough analysis of KADANT INC‘s fundamentals, I have determined that the fair value of their shares is around $229.7. This calculation is based on our proprietary Valuation Line, which takes into account various financial metrics and market conditions. However, it is important to note that the current market price for KADANT INC’s stock is $303.17, which indicates an overvaluation of 32.0%. This means that investors may be paying more for the stock than its intrinsic value, potentially leading to lower returns in the long run. One factor that may be contributing to this overvaluation is the overall bullish market sentiment, as well as specific positive news or developments related to KADANT INC. While these factors may temporarily drive up the stock price, it is important for investors to consider the company’s fundamentals in order to make informed decisions about the stock’s true value and potential for growth. In conclusion, while KADANT INC may currently be trading at a premium, it is important for investors to carefully evaluate the company’s financials and market conditions before making any investment decisions. As always, it is crucial to remember that the stock market can be unpredictable and that thorough analysis and due diligence are key to successful investing. More…
Peers
The Company’s products are used in various industrial and commercial applications, including the production of tissue, textiles, packaging, and recycled paper. Kadant’s products are also used in the pulp and paper industry for the processing of wood chips and wood fiber, and in the textile industry for the production of yarns and fabrics. The Company operates in two segments: Engineered Systems and Components, and Papermaking Systems.
– Marel hf ($OTCPK:MRRLF)
Marel hf is a international company that specializes in manufacturing equipment and systems for the food processing industry. The company has a market cap of 2.53B as of 2022 and a Return on Equity of 6.73%. Marel hf is a publicly traded company on the Nasdaq stock exchange.
– MHM Automation Ltd ($NZSE:MHM)
The company’s market capitalization is 51.53 million as of 2022, and its return on equity is 12.09%. The company manufactures and supplies a range of automation products and services. It offers a range of products, including motion control products, machine safety products, and software. The company’s products are used in a variety of industries, including automotive, food and beverage, aerospace, and pharmaceutical.
– Axtel Industries Ltd ($BSE:523850)
Axtel Industries Ltd is a publicly traded company with a market capitalization of 4.04 billion as of 2022. The company has a return on equity of 11.0%. Axtel Industries Ltd is engaged in the business of manufacturing and selling aluminum extrusions and related products. The company’s products are used in a variety of applications, including construction, transportation, packaging, and consumer goods.
Summary
Kadant Inc. is showing strong technical strength with a RS (Relative Strength) Rating of 80 or higher. This makes it an attractive potential stock to watch and possibly add to one’s portfolio. A high RS Rating can be indicative of strong price performance and potential future growth.
Investors should pay attention to stocks that have an 80 or higher RS Rating, such as Kadant Inc., when considering new investment opportunities. This can help identify potential winners in the market.
Related Posts


Recent Posts


Investing Everyone Can Do.
Investing shouldn’t be exclusive to a select few. We believe everyone should have the opportunity to grow their wealth. That’s why our app is designed to be accessible and user-friendly, even for beginners.
