Bruker Corporation Intrinsic Value Calculator – Is Bruker Corporation’s 26% Return on Equity Impressive?
May 16, 2023

Trending News ☀️
Bruker Corporation ($NASDAQ:BRKR) is a global leader in the design, manufacture and distribution of analytical and medical instrumentation. For the most recent quarter, the company reported a return on equity of 26%. This indicates that for every $1 of shareholders’ equity, the company generated 26 cents in profit. When evaluating whether Bruker Corporation’s return on equity is impressive, it is important to consider how this figure compares to other companies in the same industry.
Furthermore, the company’s return on equity has consistently been higher than its peers, indicating that it is a well-managed company that is able to generate strong returns for its shareholders. Overall, Bruker Corporation’s 26% return on equity is impressive and stands out when compared to other companies in the same industry. This demonstrates that the company is performing well and is able to generate strong returns for its shareholders.
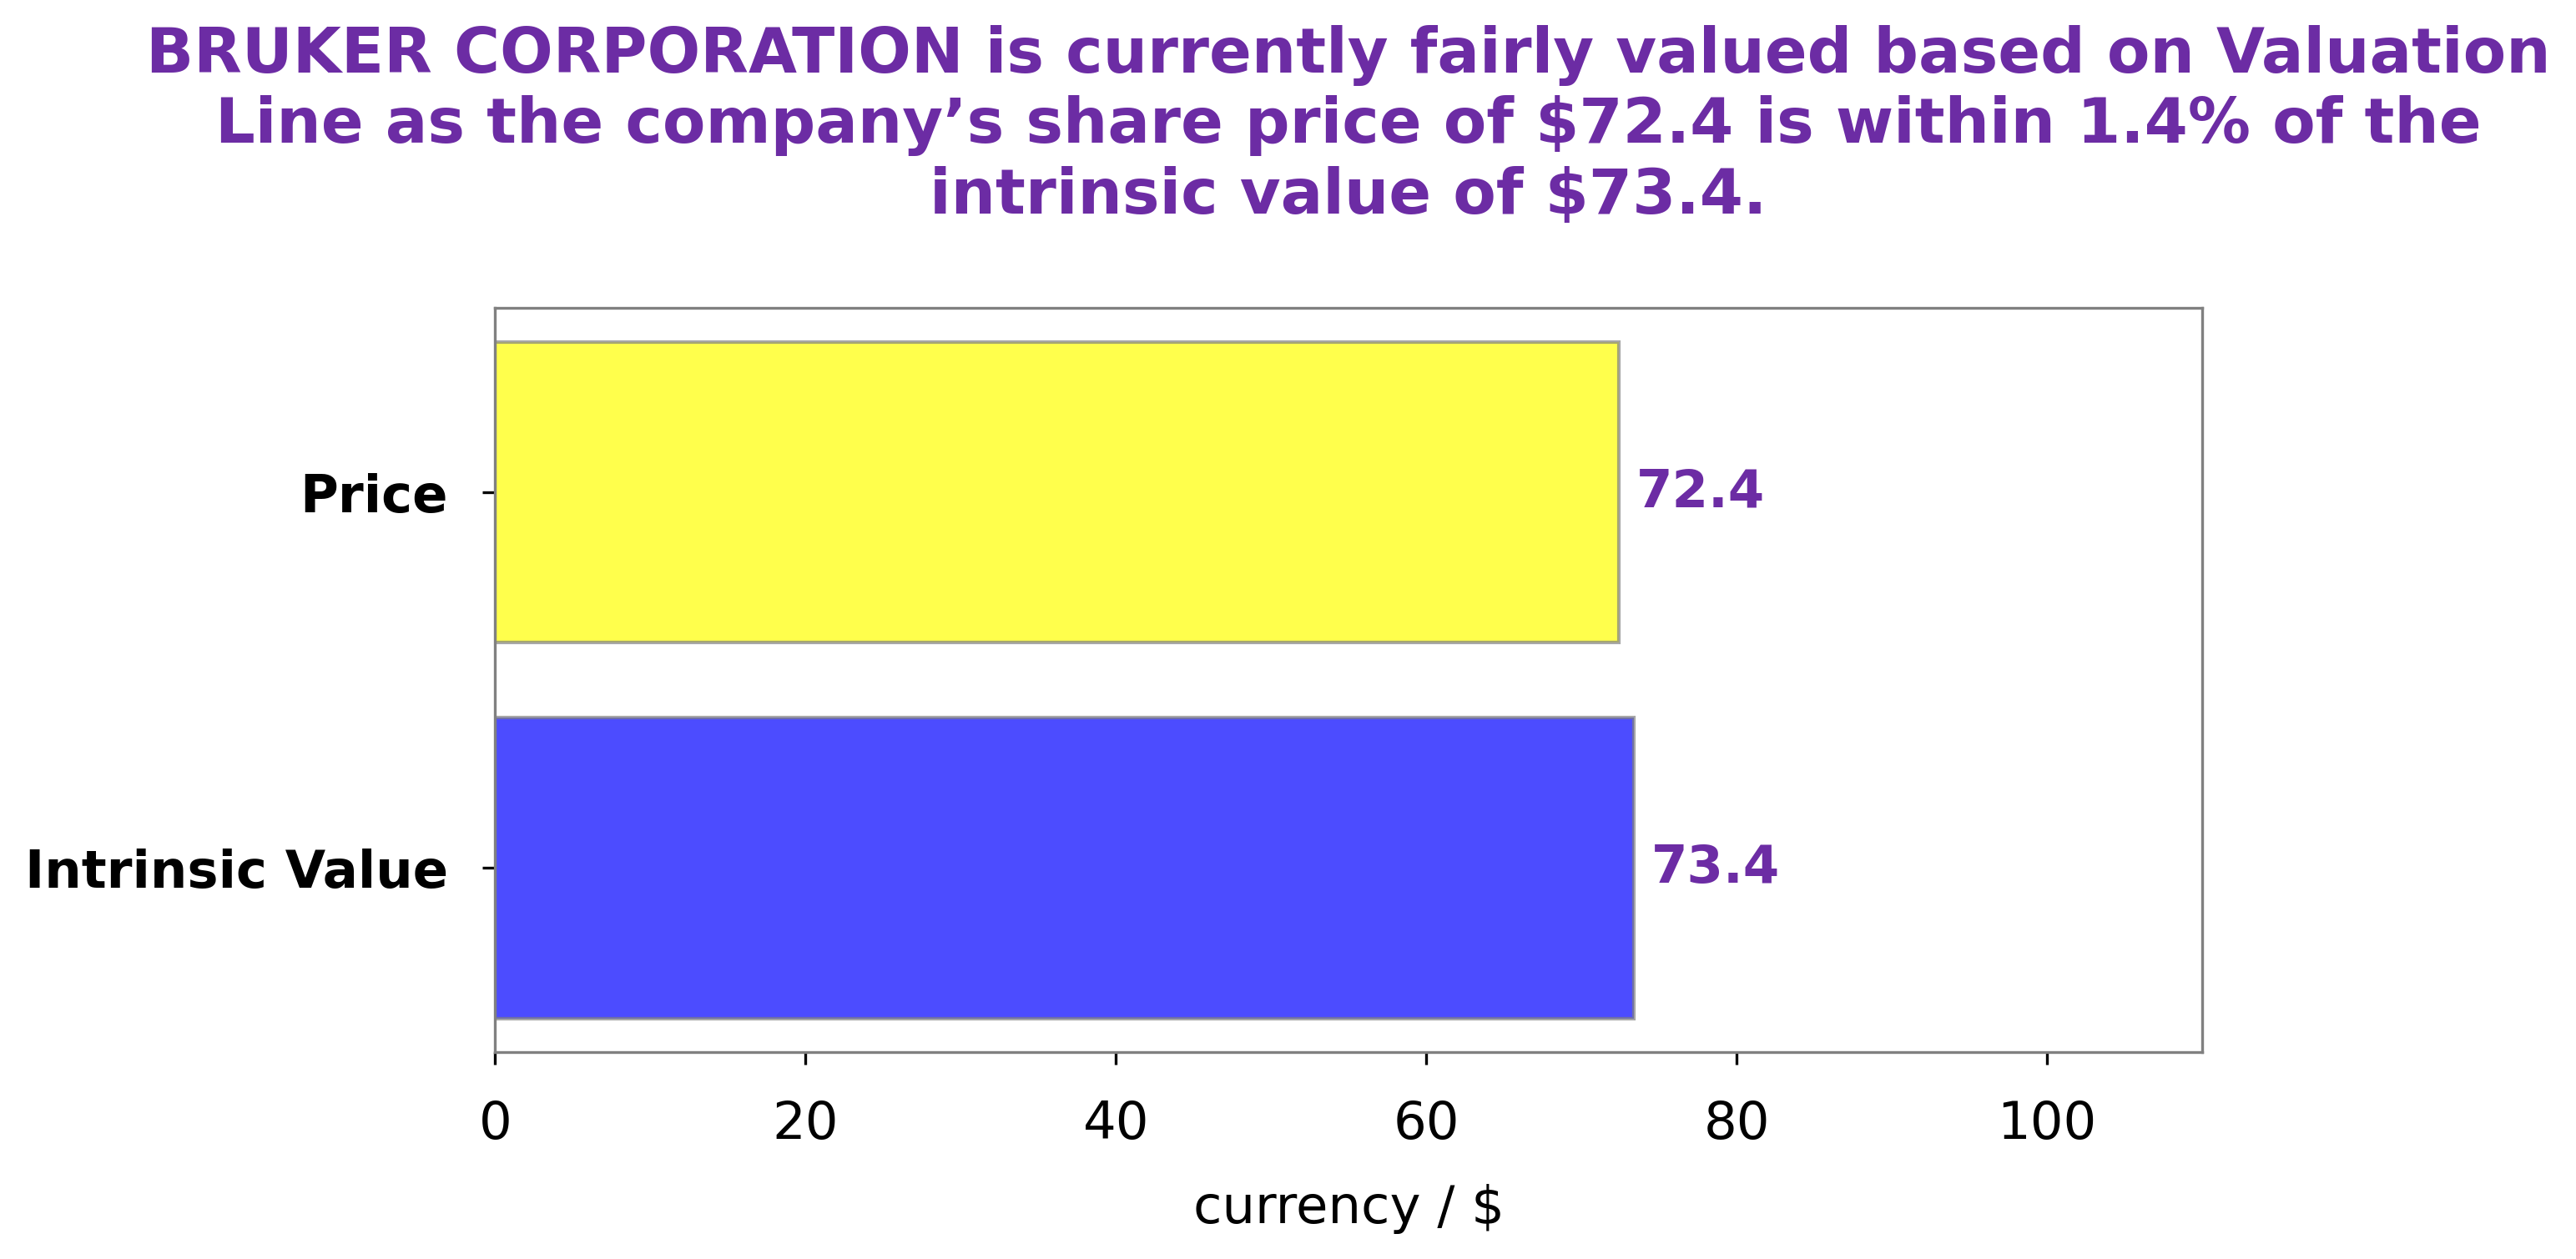
Analysis – Bruker Corporation Intrinsic Value Calculator
At GoodWhale, we have conducted a financial analysis of BRUKER CORPORATION and have calculated its fair value to be around $73.4. This valuation is based on our proprietary Valuation Line, which takes into account various factors such as profits, cash flow, debt, and market conditions. This discrepancy presents an opportunity for investors to gain some extra return through purchasing BRUKER CORPORATION shares at a discounted price. More…
About the Company
Income Snapshot
Below shows the total revenue, net income and net margin for Bruker Corporation. More…
| Total Revenues | Net Income | Net Margin |
| 2.62k | 311.5 | 12.5% |
Cash Flow Snapshot
Below shows the cash from operations, investing and financing for Bruker Corporation. More…
| Operations | Investing | Financing |
| 284.1 | -258 | -228.6 |
Balance Sheet Snapshot
Below shows the total assets, liabilities and book value per share for Bruker Corporation. More…
| Total Assets | Total Liabilities | Book Value Per Share |
| 3.76k | 2.55k | 7.58 |
Key Ratios Snapshot
Some of the financial key ratios for Bruker Corporation are shown below. More…
| 3Y Rev Growth | 3Y Operating Profit Growth | Operating Margin |
| 8.8% | 21.4% | 17.4% |
| FCF Margin | ROE | ROA |
| 5.7% | 24.6% | 7.6% |
Peers
Its products are used in a variety of applications, including drug discovery, food and environmental testing, and materials science research. The company’s main competitors are Tecan Group AG, Stevanato Group SPA, and Cerus Corporation.
– Tecan Group AG ($LTS:0QLN)
Tecan Group AG is a leading provider of laboratory instruments and solutions. The company has a market cap of 4.56B as of 2022 and a Return on Equity of 6.13%. Tecan provides a wide range of products and services for the life science research, diagnostics and pharmaceutical sectors. The company offers a broad range of solutions for drug discovery, genomics, diagnostics and forensics. Tecan also provides contract research services to the pharmaceutical industry.
– Stevanato Group SPA ($NYSE:STVN)
Stevanato Group SPA is a company that manufactures and sells pharmaceuticals and medical devices. The company has a market cap of 4.89B as of 2022 and a return on equity of 11.0%. The company’s products are sold in over 100 countries and it has a presence in Europe, North America, and Asia.
– Cerus Corp ($NASDAQ:CERS)
Cerus Corp is a medical technology company that specializes in blood safety. The company’s primary product is the Intercept Blood System, which is designed to inactivate viruses, bacteria, parasites, and other potentially harmful agents in donated blood. Cerus Corp’s market cap as of 2022 is 625.13M, and its ROE is -28.3%. The company has been facing some financial difficulties in recent years, but continues to invest in research and development in order to bring new products to market.
Summary
Investors may find Bruker Corporation’s return on equity (ROE) of 26% impressive. This metric measures the company’s ability to generate a return from its shareholder’s investment. To determine if this is a good investment, investors should look at the company’s earnings, liquidity, and financial position. Analyzing Bruker Corporation’s earnings can help determine if the company is a good investment over the long-term. Investors should compare the company’s past performance to its industry peers.
Additionally, investors should look into the company’s balance sheet and cash flow to analyze its liquidity. Finally, investors should investigate the company’s leverage, debt level, and profitability to get an overview of its financial health. Analyzing all of these factors can help investors make an informed decision about investing in Bruker Corporation.
Related Posts


Recent Posts


Investing Everyone Can Do.
Investing shouldn’t be exclusive to a select few. We believe everyone should have the opportunity to grow their wealth. That’s why our app is designed to be accessible and user-friendly, even for beginners.
