Magic Software Enterprises Misses Earnings and Revenue Estimates
May 19, 2023

Trending News 🌧️
The company’s Non-GAAP EPS was $0.26, missing analysts’ estimates by $0.02. Revenue came in at $142.4M, missing projections by $1M.
However, their actual results fell short of these expectations. This signals a slower pace of growth than the company had been expecting going into the quarter. Magic Software Enterprises ($NASDAQ:MGIC) is headquartered in Or Yehuda, Israel and provides solutions that enable organizations to rapidly develop, deploy, integrate, and manage their business-critical applications. The company’s comprehensive offering includes a wide range of end-to-end software and service offerings across multiple platforms and computing environments.
Earnings
MAGIC SOFTWARE ENTERPRISES recently announced their earnings and revenue estimates for the fourth quarter of FY2022, ending December 31 2022. The company earned 147.15M USD in total revenue and 10.07M USD in net income – an impressive 10.6% increase in total revenue and 54.7% increase in net income compared to the previous year. Over the past three years, total revenue increased from 104.57M USD to 147.15M USD. Despite these positive results, the company missed their earnings and revenue estimates for the quarter, leading to some speculation about the outlook for the company going forward.
About the Company
Income Snapshot
Below shows the total revenue, net income and net margin for MGIC. More…
| Total Revenues | Net Income | Net Margin |
| 566.79 | 38.77 | 7.2% |
Cash Flow Snapshot
Below shows the cash from operations, investing and financing for MGIC. More…
| Operations | Investing | Financing |
| 49.52 | -27.34 | -18.35 |
Balance Sheet Snapshot
Below shows the total assets, liabilities and book value per share for MGIC. More…
| Total Assets | Total Liabilities | Book Value Per Share |
| 510.97 | 205.7 | 5.37 |
Key Ratios Snapshot
Some of the financial key ratios for MGIC are shown below. More…
| 3Y Rev Growth | 3Y Operating Profit Growth | Operating Margin |
| 20.3% | 22.1% | 10.8% |
| FCF Margin | ROE | ROA |
| 7.4% | 14.9% | 7.5% |
Stock Price
On Thursday, MAGIC SOFTWARE ENTERPRISES reported its financial results for the fourth quarter of the year, and the results fell short of analysts’ estimates. The disappointing results had an immediate effect on the share price of MAGIC SOFTWARE ENTERPRISES. On Thursday, the stock opened at $14.4 and closed at $14.4, up by 1.3% from its prior closing price of 14.2. Going forward, investors will be closely monitoring the company’s performance to see if it can rebound from this quarter’s weak earnings. Live Quote…
Analysis
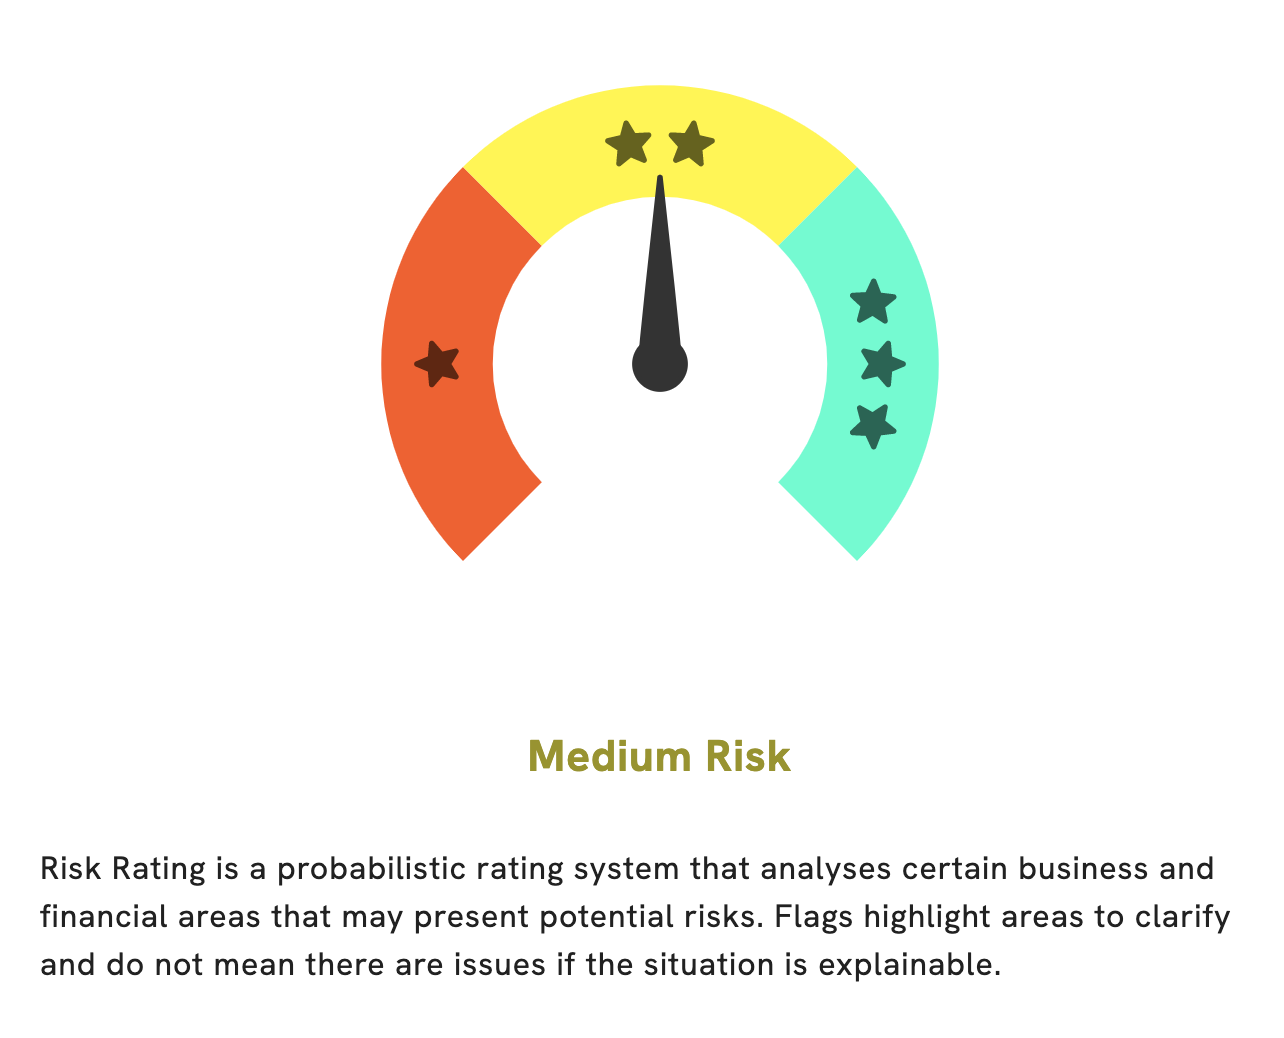
At GoodWhale, we recently performed an analysis of MAGIC SOFTWARE ENTERPRISES’s wellbeing. Based on our Risk Rating, we concluded that MAGIC SOFTWARE ENTERPRISES is a medium risk investment in terms of financial and business aspects. Our analysis revealed two risk warnings in the income sheet and balance sheet. We recommend registering on goodwhale.com to take a closer look at our detailed report and discover more insights into the company’s financial health. We hope you can make informed decisions when it comes to investing in MAGIC SOFTWARE ENTERPRISES by using our comprehensive assessment. More…
Peers
All four companies strive to stay ahead of the curve by developing innovative software solutions and providing ever-improving customer service. The competition between these leading software companies is fierce and is sure to bring about exciting new developments in the industry.
– Claranova SA ($BER:BV51)
Claranova SA is a French software company that offers digital solutions for professionals and other users. The company specializes in helping users create content for digital media, the development of connected objects and devices, and the secure distribution of digital applications. Its market capitalization of 79.92M as of 2023 reflects its strong financial performance, as evidenced by its Return on Equity of 9.21%. This return on equity signifies that Claranova SA is making effective use of its retained earnings and is achieving a satisfactory return on its shareholder’s capital. This company is well-positioned to continue to grow and develop its products, services, and customer base.
– Infotel SA ($LTS:0OQQ)
Infotel SA is a French telecommunications company that is specialized in developing telecommunications solutions and services for businesses. With a market cap of 385.75M Euros as of 2023, the company has been able to demonstrate a sound financial performance. This has been largely due to their impressive return on equity (ROE) of 15.87%. This suggests that the company has been able to efficiently reinvest its earnings to generate higher returns, making it an attractive investment opportunity.
– Tranway Technologies Ltd ($BSE:542923)
Tranway Technologies Ltd is a technology company specializing in the development of software solutions and services for businesses. As of 2023, the company has a market capitalization of 100.69M and a Return on Equity of 2.81%. The market cap of a company is the total value of its outstanding shares, and it is an indicator of the size and strength of the firm. The ROE, on the other hand, is a measure of how effectively management is utilizing the company’s equity to generate profits, and Tranway Technologies Ltd’s ROE of 2.81% indicates that it is efficiently generating returns for its owners.
Summary
Magic Software Enterprises released their earnings report for the latest quarter, showing a Non-GAAP EPS of $0.26 which missed estimates by $0.02 and a revenue of $142.4M which also missed estimates by $1M. This result is lower than the same period last year and brings their year to date earnings down. Analysts have lowered their price target on the stock as a result. Investors may want to wait for further analysis before making any decisions, as this could indicate a short term pullback in market performance.
Related Posts


Recent Posts


Investing Everyone Can Do.
Investing shouldn’t be exclusive to a select few. We believe everyone should have the opportunity to grow their wealth. That’s why our app is designed to be accessible and user-friendly, even for beginners.
