Lifetime Brands Reports Surprise Earnings Beat Despite Revenue Miss
May 11, 2023

Trending News ☀️
Lifetime Brands ($NASDAQ:LCUT) Inc. surprised investors with a higher-than-expected non-GAAP earnings per share (EPS) of -$0.12 in their latest quarterly report, beating forecasts by $0.08. Lifetime Brands is a leading global provider of kitchenware, tableware and other products used in the home. It has established a strong reputation for innovation and product design, as well as a commitment to quality, reliability and safety. Despite missing its revenue target, the company was able to report an earnings beat due to cutting spending and carefully managing operational costs.
Additionally, the company’s portfolio of brands including Farberware, KitchenAid, Mikasa and others experienced a resurgence in demand as consumers looked to restock their kitchens after a year of pandemic-related lockdowns and restrictions. Looking forward, Lifetime Brands is confident that its improved cost structure and exposure to high-quality products and brand names will enable it to continue to deliver value to shareholders in the coming years.
Earnings
In its earning report of FY2022 Q4 as of December 31 2022, LIFETIME BRANDS reported total revenue of 207.04M USD and net income of 3.27M USD, representing a 19.1% decrease in total revenue and a 619.0% decrease in net income from the previous year. Despite the lower-than-expected revenue, LIFETIME BRANDS still managed to surprise analysts with an earnings beat.
About the Company
Income Snapshot
Below shows the total revenue, net income and net margin for Lifetime Brands. More…
| Total Revenues | Net Income | Net Margin |
| 727.66 | -6.17 | -0.9% |
Cash Flow Snapshot
Below shows the cash from operations, investing and financing for Lifetime Brands. More…
| Operations | Investing | Financing |
| 24.32 | -20.93 | -7.62 |
Balance Sheet Snapshot
Below shows the total assets, liabilities and book value per share for Lifetime Brands. More…
| Total Assets | Total Liabilities | Book Value Per Share |
| 725.89 | 485.8 | 11.02 |
Key Ratios Snapshot
Some of the financial key ratios for Lifetime Brands are shown below. More…
| 3Y Rev Growth | 3Y Operating Profit Growth | Operating Margin |
| -0.3% | 13.6% | 3.6% |
| FCF Margin | ROE | ROA |
| 2.9% | 6.9% | 2.3% |
Stock Price
Despite missing the consensus revenue estimate, the company reported that their profits increased significantly from the prior quarter. As a result, the company’s stock opened at $5.4, however by the end of the day it had dropped 3.1%, closing at $5.0 from its prior closing price of $5.2. Live Quote…
Analysis
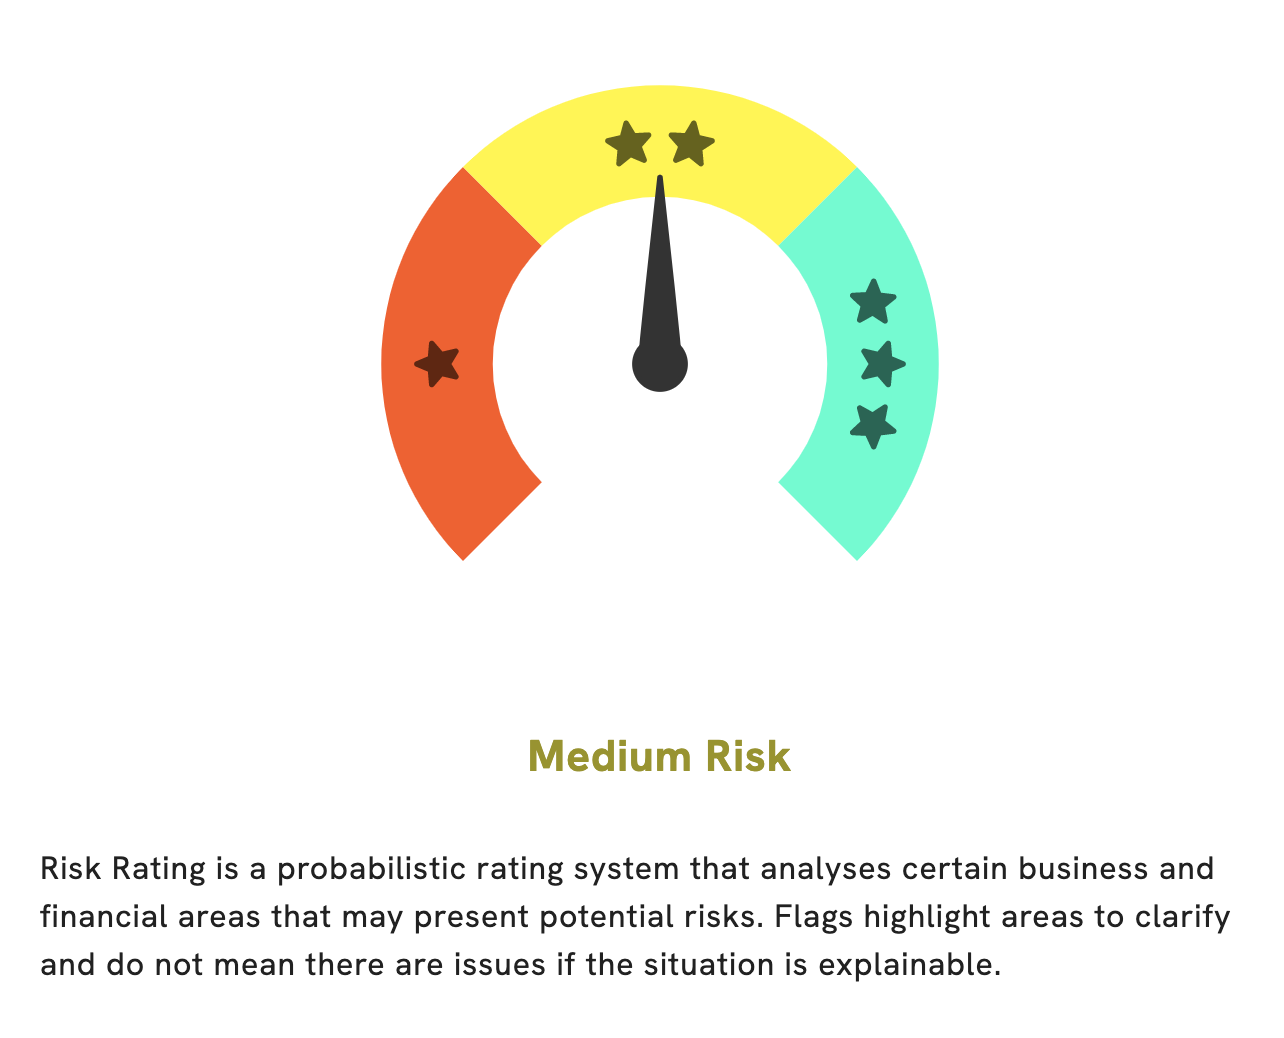
At GoodWhale, we recently completed an analysis of the financials of LIFETIME BRANDS. Our Risk Rating for the company has determined that it is a medium risk investment in terms of financial and business aspects. We have detected two risk warnings in the company’s income sheet and balance sheet. To view these warnings and gain further insight into the company’s financials, please visit our website, goodwhale.com. We provide free access to view the financial information and compare it to similar companies in its industry. At GoodWhale, we strive to provide comprehensive and accurate analysis of financials so that investors can make the best decisions for their money. We hope that our analysis of LIFETIME BRANDS will help investors make a more informed investment decision. More…
Peers
In the highly competitive world of home improvement and furnishings, Lifetime Brands Inc has been pitted against some tough competition. Westwing Group SE, Howden Joinery Group PLC, and Bloom Dekor Ltd are all companies that offer similar products and services. Each company has its own unique selling points, which it uses to attract customers. In order to stay ahead of the competition, Lifetime Brands Inc has to continuously come up with new and innovative products and services that appeal to its target market. It is only through continuous innovation and excellent customer service that Lifetime Brands Inc will be able to maintain its position as a leading player in this industry.
– Westwing Group SE ($OTCPK:WTWGF)
Westwing Group SE is a German home and living e-commerce company headquartered in Munich. It offers a curated selection of home décor and furnishing products. The company operates in 11 countries: Austria, Belgium, Czech Republic, France, Germany, Italy, Netherlands, Poland, Portugal, Spain, and Switzerland. As of December 31, 2020, Westwing Group SE had 2,958 employees.
– Howden Joinery Group PLC ($LSE:HWDN)
Howden Joinery Group PLC is a British company that manufactures and sells kitchens, joinery and timber products. It has a market capitalization of £2.9 billion as of March 2021 and a return on equity of 28.49%. The company operates through two segments: Joinery and Timber. The Joinery segment manufactures and sells kitchens, joinery and related products through its Howdens brand in the United Kingdom, France, Belgium, the Netherlands and Ireland. The Timber segment manufactures and sells timber products, including flooring, decking, fencing and cladding, through its Timberland brand in the United Kingdom.
– Bloom Dekor Ltd ($BSE:526225)
Bekor Ltd is a publicly traded company with a market capitalization of 123.64M as of 2022. The company has a return on equity of -27.74%. Bekor Ltd is engaged in the business of manufacturing and selling decorative products. The company’s products include wallpapers, fabrics, and other home decor items.
Summary
Lifetime Brands reported its non-GAAP earnings per share of -$0.12, which was $0.08 higher than expected.
However, the revenue of $145.4M missed expectations by $14.24M. On the same day, the stock price decreased. This suggests that investors are not optimistic about the company’s outlook due to its weak revenue performance. Further analysis should consider the company’s fundamentals and financials to determine whether it is a good long-term investment.
Additionally, investors should consider other factors like industry trends and market sentiment before investing in Lifetimes Brands.
Related Posts


Recent Posts


Investing Everyone Can Do.
Investing shouldn’t be exclusive to a select few. We believe everyone should have the opportunity to grow their wealth. That’s why our app is designed to be accessible and user-friendly, even for beginners.
