Tyson Foods Reports Negative Non-GAAP EPS, Misses Revenue Expectations by $490M
May 9, 2023

Trending News 🌧️
Tyson Foods ($NYSE:TSN), one of the world’s largest processors and marketers of chicken, beef, and pork, recently reported its Non-GAAP EPS of -$0.04, which was far below the expected $0.84. Revenue also fell short of expectations, with Tyson Foods reporting a total of $13.13B, a figure that was $490M lower than forecasted. The company has long been a leader in food production with products including Tyson chicken, Hillshire Farm, Jimmy Dean, Ball Park and State Fair. Tyson Foods offers protein-packed products for retail, foodservice, and other industries and prides itself on high-quality ingredients and superior customer service. The most recent earnings report marks a disappointing setback for the company. In order to remain competitive in an increasingly demanding market, Tyson Foods will need to focus on its core strengths and develop strategies that will help it make up for the missed revenue.
In addition, the company will need to find innovative ways to improve efficiency and quality in order to return to positive growth.
Share Price
On Monday, TYSON FOODS reported negative non-GAAP EPS and missed revenue expectations by $490M. As a result, their stock opened at $54.4 and closed at $50.7, resulting in a 16.4% plunge from their previous closing price of 60.7. The reported EPS and revenue miss were both unexpected, and have caused many analysts to question the long-term future of the company. Investors are now closely watching the stock to see if it will continue to drop or recover, as the next few days could determine the company’s future success. Live Quote…
About the Company
Income Snapshot
Below shows the total revenue, net income and net margin for Tyson Foods. More…
| Total Revenues | Net Income | Net Margin |
| 53.61k | 2.43k | 4.5% |
Cash Flow Snapshot
Below shows the cash from operations, investing and financing for Tyson Foods. More…
| Operations | Investing | Financing |
| 2.02k | -2.15k | -2.32k |
Balance Sheet Snapshot
Below shows the total assets, liabilities and book value per share for Tyson Foods. More…
| Total Assets | Total Liabilities | Book Value Per Share |
| 36.68k | 16.89k | 55.21 |
Key Ratios Snapshot
Some of the financial key ratios for Tyson Foods are shown below. More…
| 3Y Rev Growth | 3Y Operating Profit Growth | Operating Margin |
| 7.6% | 6.3% | 6.6% |
| FCF Margin | ROE | ROA |
| -0.1% | 11.2% | 6.0% |
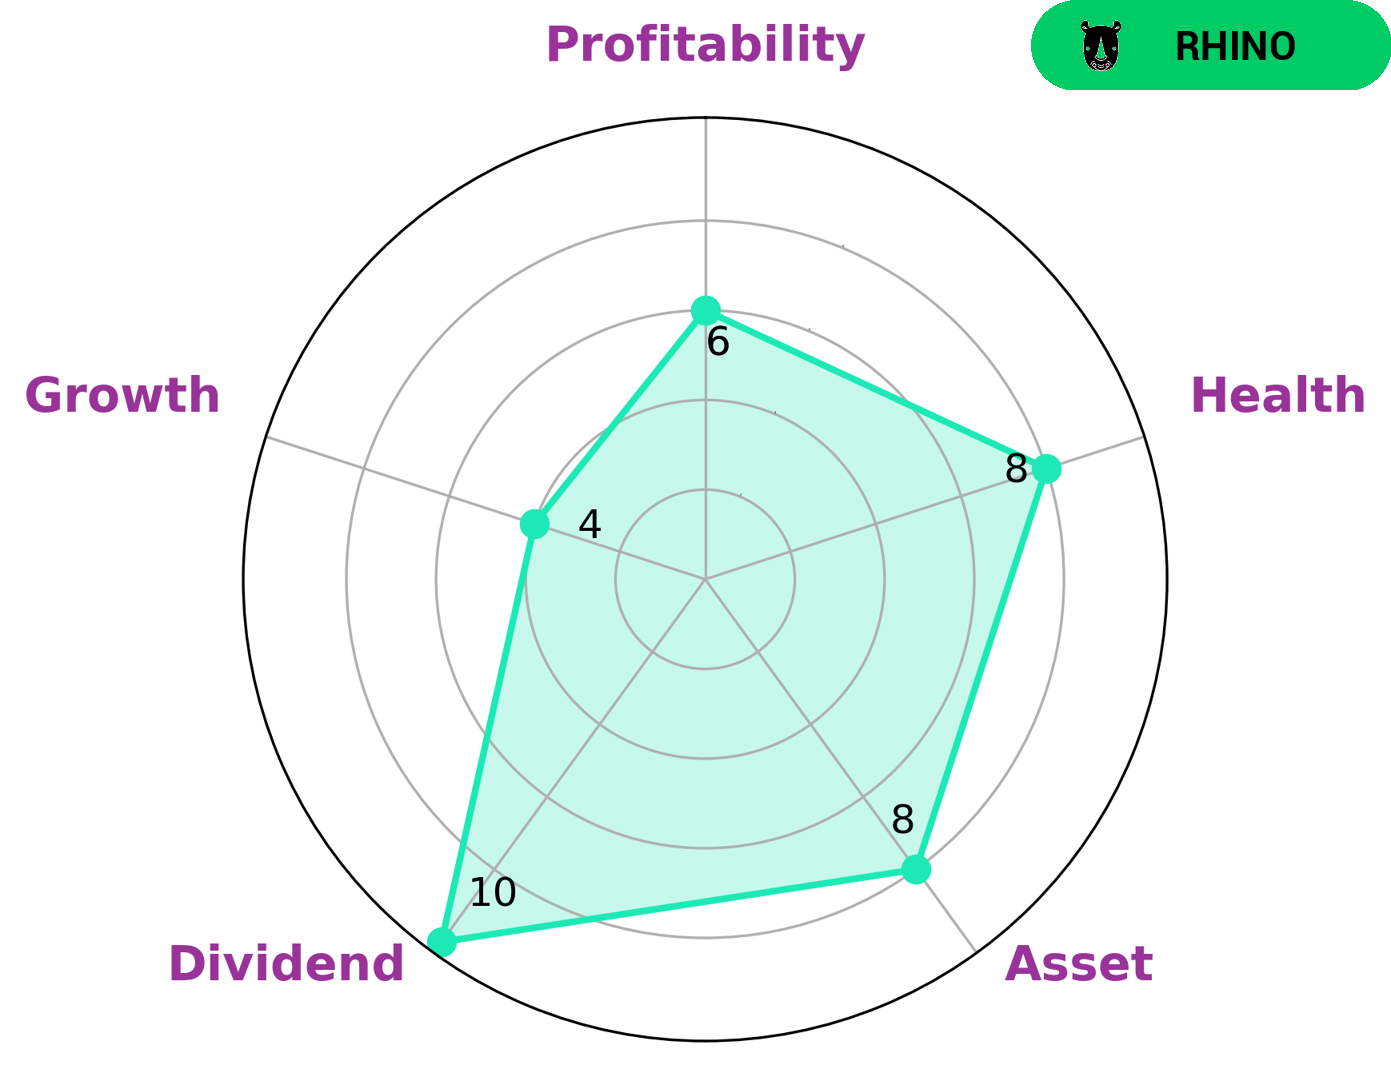
Analysis
As part of GoodWhale’s analysis of the wellbeing of TYSON FOODS, we have used our Star Chart to assess the company’s position in terms of asset, dividend, and growth, profitability. TYSON FOODS is classified as a ‘rhino’, a type of company which we have concluded has achieved moderate revenue or earnings growth. Based on this assessment, it is clear that TYSON FOODS has strong positions in some areas and weaker positions in others. Investors may be interested in this type of company due to its potential for moderate growth. Furthermore, TYSON FOODS has a high health score of 8/10 with regard to its cashflows and debt. This means that the company is capable of safely riding out any crisis without the risk of bankruptcy, making it an attractive option for those investors looking for stability. More…
Peers
The competition in the packaged food industry is fierce, with Tyson Foods Inc, General Mills Inc, Hormel Foods Corp, and Kellogg Co all vying for a share of the market. Each company has its own strengths and weaknesses, and it is up to the consumer to decide which brand they want to purchase.
– General Mills Inc ($NYSE:GIS)
General Mills is an American multinational manufacturer and marketer of branded consumer foods sold through retail stores. It is headquartered in Golden Valley, Minnesota, a suburb of Minneapolis. The company markets many well-known North American brands, such as Gold Medal flour, Annie’s Homegrown, Betty Crocker, Yoplait, Colombo, Totino’s, Pillsbury, Old El Paso, Häagen-Dazs, Cheerios, Trix, Cocoa Puffs, and Lucky Charms.
– Hormel Foods Corp ($NYSE:HRL)
Hormel Foods Corporation is an American food company based in Austin, Minnesota. The company was founded as George A. Hormel & Company in 1891 by George A. Hormel. The company is listed on the New York Stock Exchange and is a member of the S&P 500 index. The company operates in more than 40 countries and markets to more than 80 countries.
– Kellogg Co ($NYSE:K)
Kellogg Co is a food manufacturing company that produces cereal, snacks, and other packaged foods. The company has a market cap of 25.03B as of 2022 and a Return on Equity of 33.71%. Kellogg Co’s products are sold in more than 180 countries and its brands include Kellogg’s, Keebler, Pop-Tarts, and Eggo.
Summary
Revenue of $13.13B also missed estimates by nearly half a billion dollars. As a result of these figures, the stock price dropped on the same day. From an investing perspective, Tyson Foods has not had an optimal performance in terms of financial metrics. Investors should carefully consider the risks associated with investing in the company going forward, as well as the potential for future growth.
Related Posts


Recent Posts


Investing Everyone Can Do.
Investing shouldn’t be exclusive to a select few. We believe everyone should have the opportunity to grow their wealth. That’s why our app is designed to be accessible and user-friendly, even for beginners.
