Fabrinet Reports Record Q1 Earnings, Beating Analyst Estimates by $0.07 and $14.75M Respectively.
May 10, 2023

Trending News 🌧️
The company reported impressive Non-GAAP earnings per share (EPS) of $1.94, beating analyst estimates by $0.07. This marks an impressive quarter for Fabrinet ($NYSE:FN), as the company has seen steady growth over the past few years. Fabrinet provides services to customers across a wide range of industries including aerospace, automotive, medical and telecom. The company is headquartered in Bangkok, Thailand, with additional operations in Germany, Mexico, the United States and the United Kingdom.
Fabrinet continues to demonstrate its success through innovative solutions, advances in technology and exceptional customer service. This record breaking quarter is further evidence that Fabrinet is well positioned to continue its strong performance throughout the remainder of the fiscal year.
Stock Price
On Monday, Fabrinet reported record earnings for the first quarter of the year, beating analyst estimates by $0.07 and $14.75M respectively. The news triggered a small surge in the stock, which opened at $93.4 and closed at $93.5, a 0.4% increase from its previous closing price of 93.1. The company’s earnings report showed that despite economic uncertainty and disruption caused by the pandemic, Fabrinet managed to produce strong results and exceed expectations.
Analysts attributed the strong performance to the company’s focus on technology, process optimization, and cost management. Going forward, the company expects to continue to benefit from its core strengths and strategic partnerships, which should further drive its financials and stock performance in the coming quarters. Live Quote…
About the Company
Income Snapshot
Below shows the total revenue, net income and net margin for Fabrinet. More…
| Total Revenues | Net Income | Net Margin |
| 2.48k | 234.62 | 9.5% |
Cash Flow Snapshot
Below shows the cash from operations, investing and financing for Fabrinet. More…
| Operations | Investing | Financing |
| 171.78 | -103.35 | -94.21 |
Balance Sheet Snapshot
Below shows the total assets, liabilities and book value per share for Fabrinet. More…
| Total Assets | Total Liabilities | Book Value Per Share |
| 1.97k | 583.89 | 37.83 |
Key Ratios Snapshot
Some of the financial key ratios for Fabrinet are shown below. More…
| 3Y Rev Growth | 3Y Operating Profit Growth | Operating Margin |
| 15.0% | 23.2% | 9.8% |
| FCF Margin | ROE | ROA |
| 4.4% | 11.3% | 7.7% |
Analysis
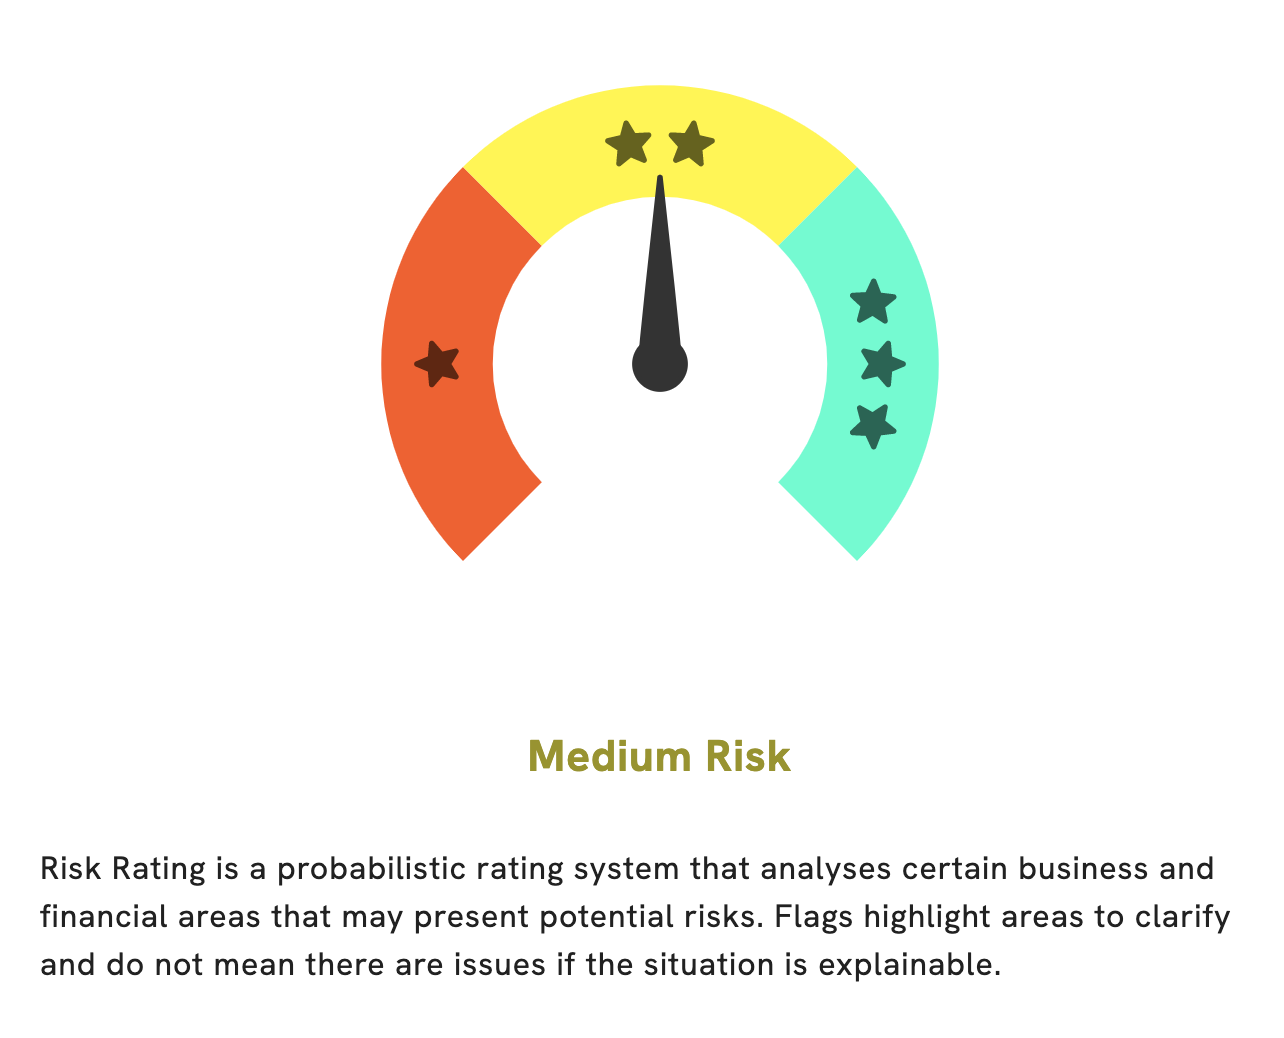
At GoodWhale, we have been taking a close look at FABRINET‘s financials and our analysis has revealed that FABRINET is a medium risk investment when it comes to financial and business aspects. We have broken down our evaluation into different categories, in order to thoroughly assess the potential risks associated with this investment. Our Risk Rating assesses FABRINET’s financials in terms of liquidity, profitability, capital structure, and other key metrics. Based on our analysis, FABRINET is rated as a medium risk investment. This means that potential investors should be aware that there are areas with potential risks. For a comprehensive look at the areas with potential risks, you can become a registered user of GoodWhale and gain access to our analysis. Our platform will provide you with the most up-to-date insights into FABRINET’s financials, so you can make an informed decision. More…
Peers
The company services a diverse set of markets, including telecommunications, data communications, aerospace and defense, industrial, life sciences, medical devices, and consumer electronics. Fabrinet has a strong competitive position in its markets, with a comprehensive suite of capabilities and a global footprint. The company’s competitors include Castech Inc, TT Electronics PLC, Gooch & Housego PLC, and others.
– Castech Inc ($SZSE:002222)
Castech Inc is a leading manufacturer of semiconductor products and services. The company has a market cap of 6.84B as of 2022 and a return on equity of 12.34%. The company’s products and services are used in a variety of electronic devices and systems, including computers, cell phones, and automotive electronics.
– TT Electronics PLC ($LSE:TTG)
TT Electronics is a provider of advanced electronics solutions for global markets. The company designs and manufactures electronic components, systems and services for applications in the aerospace, defence, rail, oil and gas, marine, medical, power generation and distribution, and industrial markets.
TT Electronics has a market capitalisation of £232.53 million as of March 2022 and a return on equity of 3.65%. The company designs and manufactures electronic components, systems and services for applications in the aerospace, defence, rail, oil and gas, marine, medical, power generation and distribution, and industrial markets.
– Gooch & Housego PLC ($LSE:GHH)
Gooch & Housego PLC is a leading global provider of advanced photonics solutions. They design, manufacture and supply a wide range of optical components, systems and instrumentation to meet the needs of their customers worldwide. Gooch & Housego has a market cap of 118.69M as of 2022 and a return on equity of 3.16%. The company has a strong focus on innovative photonics solutions and providing excellent customer service.
Summary
Fabrinet is a provider of advanced optical packaging and precision optical, electro-mechanical and electronic manufacturing services to original equipment manufacturers of complex products. Recently, its non-GAAP earnings per share of $1.94 beat estimates by $0.07, while revenue came in at $665.28M exceeding expectations by $14.75M. This news is likely to have a positive effect on the company’s stock price as investors are optimistic about the company’s future performance. Investors may want to consider the company’s financial strength, the strength of its underlying industries, and macroeconomic trends when making an investing decision.
Related Posts


Recent Posts


Investing Everyone Can Do.
Investing shouldn’t be exclusive to a select few. We believe everyone should have the opportunity to grow their wealth. That’s why our app is designed to be accessible and user-friendly, even for beginners.
