VTEX Reports Record Third Quarter Earnings for Fiscal Year 2023
November 24, 2023

🌥️Earnings Overview
On November 7, 2023, VTEX ($NYSE:VTEX) reported its earnings results for the third quarter of Fiscal Year 2023 (ending September 30, 2023). Total revenue for the period increased 30.7% year-over-year to USD 50.6 million and net income improved significantly, rising from -11.5 million in the same quarter of the prior year to -2.4 million.
Stock Price
The news sent shares of the company soaring by 5.4% to close the day at $5.9 from the previous closing price of $5.6. This marked the highest closing price yet for VTEX, with the stock having opened at $5.5 earlier in the day. The impressive earnings report was attributed to a surge in demand for VTEX’s software solutions, specifically their e-commerce platform. Their net income was also up by 10% from the same quarter last year, demonstrating their ability to manage their finances efficiently and maximize profit margins.
With the positive performance this quarter, VTEX is now well-positioned to finish the rest of the fiscal year on a high note. Analysts predict that the company will continue to see solid growth over the next few months, with share prices predicted to rise further. Therefore, investors and shareholders alike should take advantage of the current market situation and invest in VTEX if they have not already done so. Live Quote…
About the Company
Income Snapshot
Below shows the total revenue, net income and net margin for Vtex. More…
| Total Revenues | Net Income | Net Margin |
| 186.28 | -17.24 | -6.1% |
Cash Flow Snapshot
Below shows the cash from operations, investing and financing for Vtex. More…
| Operations | Investing | Financing |
| -2.84 | 33.02 | -36.34 |
Balance Sheet Snapshot
Below shows the total assets, liabilities and book value per share for Vtex. More…
| Total Assets | Total Liabilities | Book Value Per Share |
| 337.3 | 91.04 | 1.33 |
Key Ratios Snapshot
Some of the financial key ratios for Vtex are shown below. More…
| 3Y Rev Growth | 3Y Operating Profit Growth | Operating Margin |
| 37.0% | – | -10.4% |
| FCF Margin | ROE | ROA |
| -1.7% | -4.8% | -3.6% |
Analysis
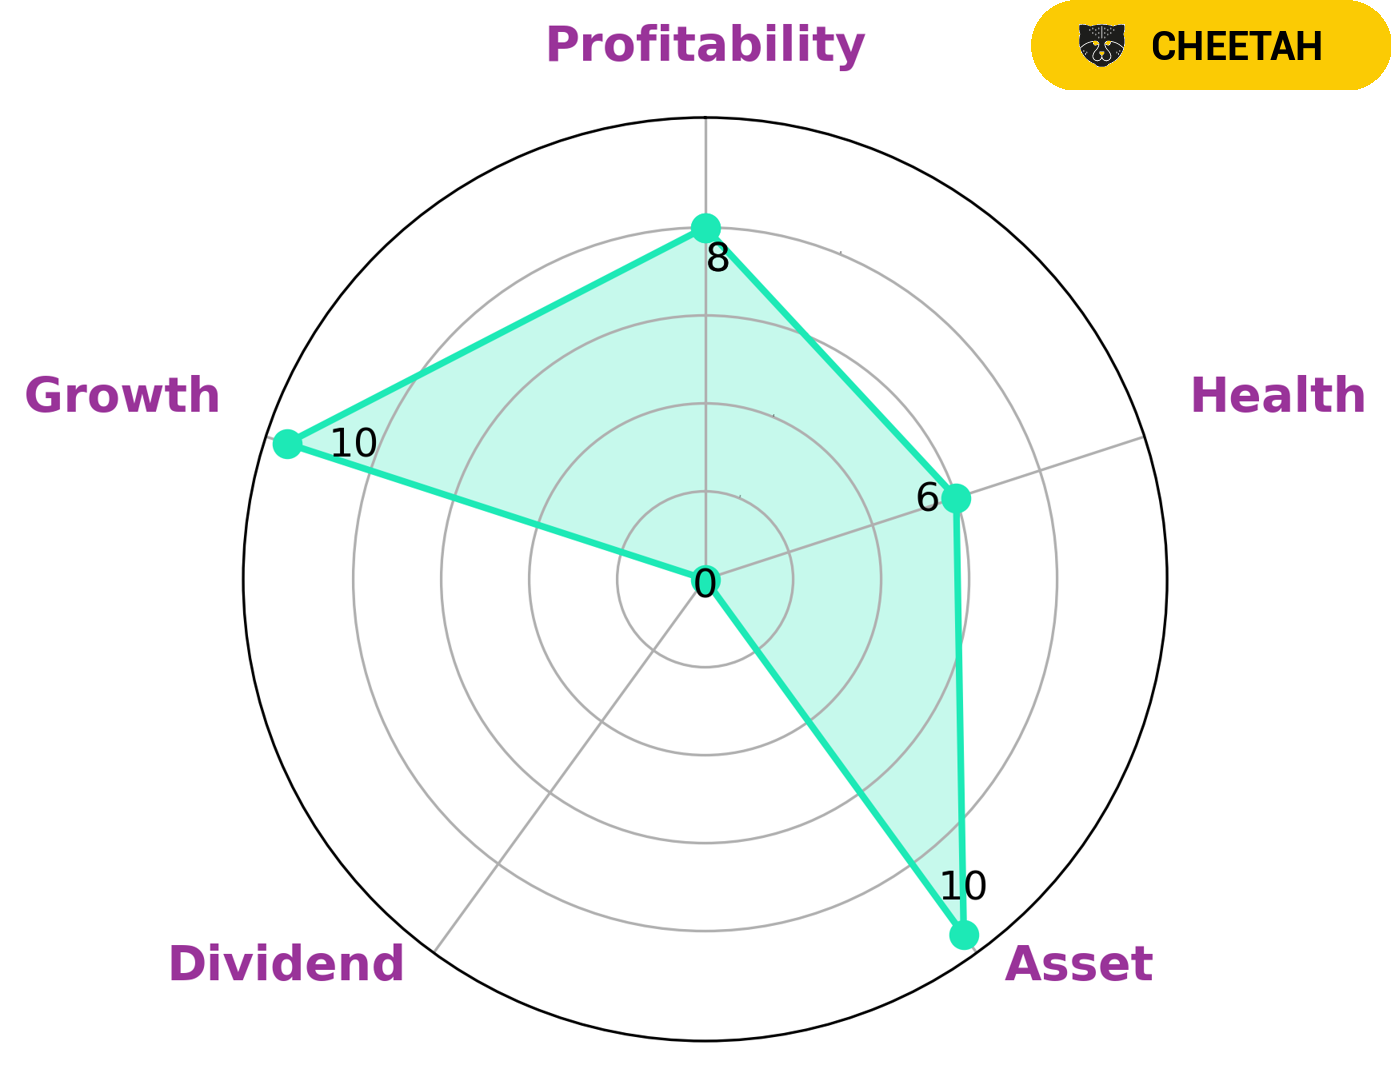
As GoodWhale, we have conducted an analysis of VTEX‘s financials. According to the Star Chart, VTEX is classified as a ‘cheetah’, a type of company that has achieved high revenue or earnings growth but is considered less stable due to lower profitability. VTEX is strong in terms of assets and growth but weak in dividends and profitability. Furthermore, VTEX has a high health score of 7/10 with regard to its cashflows and debt, meaning it is capable to safely ride out any crisis without the risk of bankruptcy. Given the nature of VTEX’s financials, it is likely to attract investors who are looking for growth opportunities and are willing to take on a bit more risk in return for potential rewards. Additionally, investors who have a portfolio that is focused on tech companies may find VTEX particularly appealing. More…
Peers
The company offers a suite of tools for creating and managing an online store, including a drag-and-drop website builder, product management, order management, and shipping. Vtex also offers a marketplace that allows businesses to sell their products to a wider audience. BigCommerce Holdings Inc, UserTesting Inc, and Riskified Ltd are all Vtex’s competitors. BigCommerce is a leading ecommerce platform that enables businesses to create an online store. UserTesting is a leading provider of user experience testing and feedback. Riskified is a leading provider of fraud prevention and chargeback protection for ecommerce businesses.
– BigCommerce Holdings Inc ($NASDAQ:BIGC)
BigCommerce is a publicly traded ecommerce platform. The company has a market capitalization of 601.97 million as of 2022 and a return on equity of -116.92%. BigCommerce provides businesses with an ecommerce platform for selling online, in-store, and through marketplaces. The company also offers a number of services, including payments, shipping, fraud prevention, and tax calculation. BigCommerce is headquartered in Austin, Texas.
– UserTesting Inc ($NYSE:USER)
UserTesting Inc is a publicly traded company that provides user experience testing services. The company has a market capitalization of 1.08 billion as of 2022 and a return on equity of -30.44%. UserTesting Inc was founded in 2007 and is headquartered in San Francisco, California.
– Riskified Ltd ($NYSE:RSKD)
Riskified is a technology company that uses data and machine learning to approve e-commerce transactions and protect businesses from fraud. The company has a market cap of $861.57 million and a return on equity of -14.29%. Riskified was founded in 2012 and is headquartered in New York, New York.
Summary
This news caused the stock price to move up the same day, indicating that investors are optimistic about the company’s financials. However, further analysis is needed to assess if this uptrend will continue and if the company can sustain its performance in the long-term.
Related Posts


Recent Posts


Investing Everyone Can Do.
Investing shouldn’t be exclusive to a select few. We believe everyone should have the opportunity to grow their wealth. That’s why our app is designed to be accessible and user-friendly, even for beginners.
