VERTIV HOLDINGS Reports Q2 FY2023 Earnings Results on August 2, 2023
August 5, 2023

🌥️Earnings Overview
VERTIV HOLDINGS ($NYSE:VRT) reported its fiscal second quarter earnings results for the period ending June 30 2023, on August 2 2023. Total revenue rose 23.9% year-over-year to USD 1734.1 million. Net income jumped to USD 83.2 million, compared to the previous year’s total of USD 20.3 million.
Market Price
On Wednesday, August 2, 2023, VERTIV HOLDINGS reported their Q2 FY2023 earnings results. The stock opened at $33.0 and closed at $34.3, soaring by 29.2% from the prior closing price of $26.5. This marks a remarkable jump in the stock price and can be largely attributed to their strong performance in the second quarter of the fiscal year. Furthermore, the company revealed that it had achieved double-digit growth in its core businesses: cloud computing, data centers, and related technologies.
The strong performance in the second quarter is an encouraging sign for investors, as VERTIV HOLDINGS continues to demonstrate resilience in the face of global economic uncertainty. With the company projecting continued growth for the next quarter, investors may be wise to keep a keen eye on VERTIV HOLDINGS stock in the future. Live Quote…
About the Company
Income Snapshot
Below shows the total revenue, net income and net margin for Vertiv Holdings. More…
| Total Revenues | Net Income | Net Margin |
| 6.39k | 181.3 | 4.0% |
Cash Flow Snapshot
Below shows the cash from operations, investing and financing for Vertiv Holdings. More…
| Operations | Investing | Financing |
| 480.7 | -105.9 | -297.2 |
Balance Sheet Snapshot
Below shows the total assets, liabilities and book value per share for Vertiv Holdings. More…
| Total Assets | Total Liabilities | Book Value Per Share |
| 7.26k | 5.6k | 4.37 |
Key Ratios Snapshot
Some of the financial key ratios for Vertiv Holdings are shown below. More…
| 3Y Rev Growth | 3Y Operating Profit Growth | Operating Margin |
| 49.8% | 105.3% | 7.7% |
| FCF Margin | ROE | ROA |
| 5.6% | 19.2% | 4.3% |
Analysis
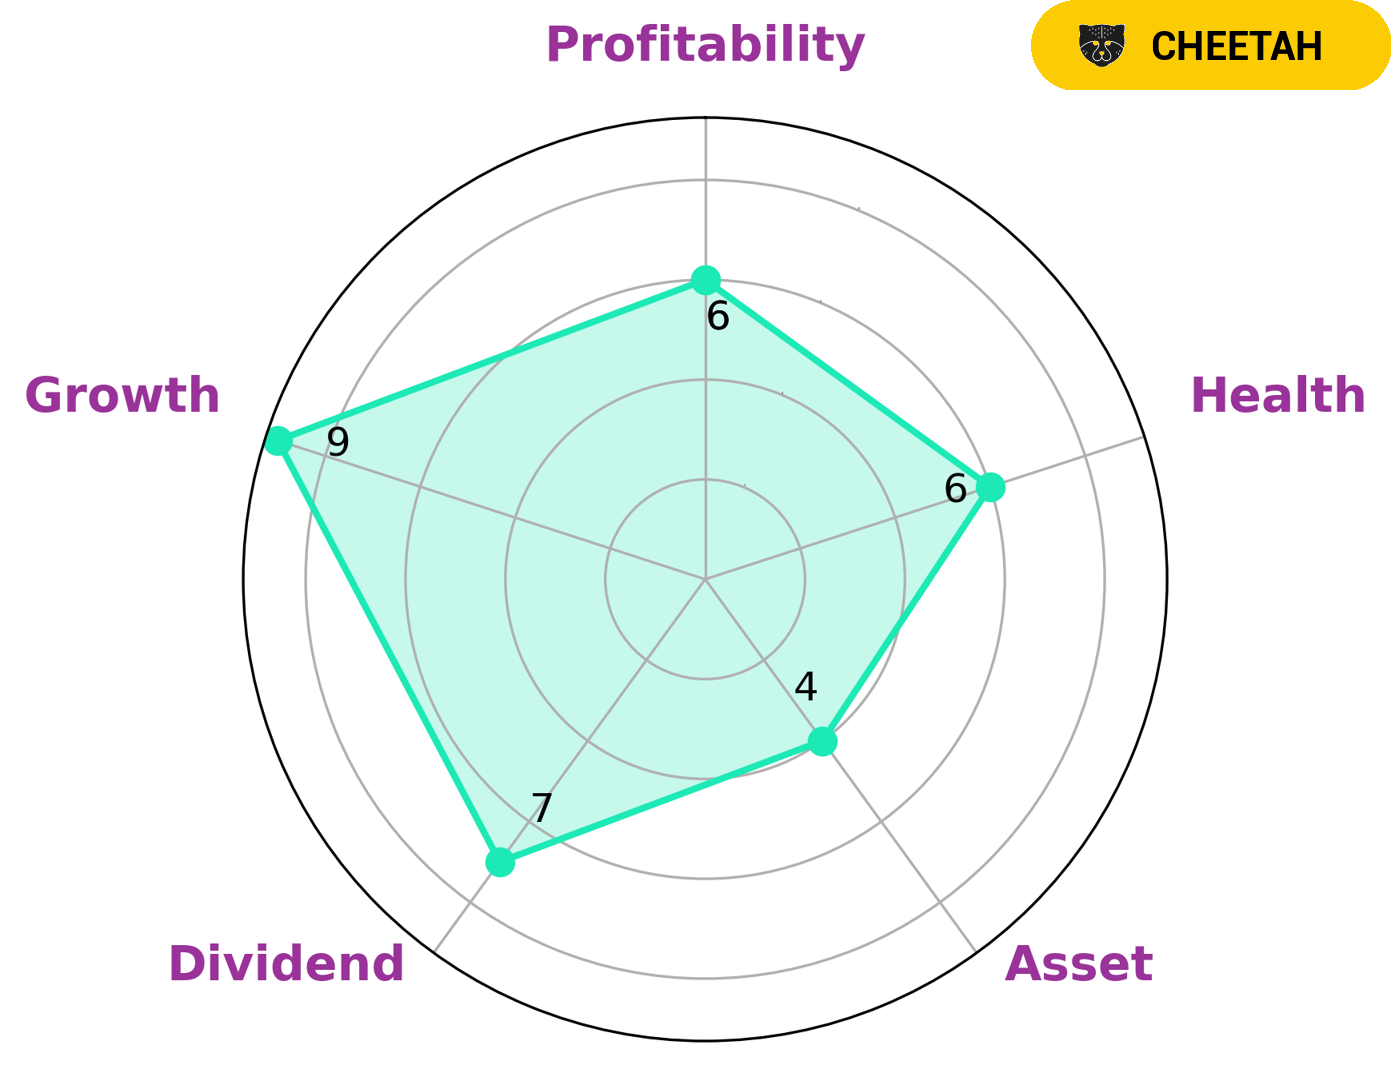
As GoodWhale, it is our task to analyze the wellbeing of VERTIV HOLDINGS. Looking at the Star Chart, it appears VERTIV HOLDINGS is strong in growth, medium in dividend, profitability and weak in asset. However, its intermediate health score of 5/10 with regard to its cashflows and debt suggests that it might be able to pay off its debt and fund future operations. We have classified VERTIV HOLDINGS as a ‘Cheetah’, a type of company which has achieved high revenue or earnings growth but is considered less stable due to lower profitability. Investors interested in such companies would likely be looking for higher than average returns, despite the risks associated with them. More…
Peers
The competition among Vertiv Holdings Co, Enedo PLC, Landis+Gyr Group AG, and Cyberpower Systems Inc is fierce. All four companies are vying for a share of the market for critical infrastructure solutions. Enedo PLC is a provider of critical infrastructure solutions. Landis+Gyr Group AG is a provider of critical infrastructure solutions. Cyberpower Systems Inc is a provider of critical infrastructure solutions.
– Enedo PLC ($LTS:0E96)
Enedo PLC is a clinical-stage biopharmaceutical company dedicated to the development of first-in-class therapies for the treatment of cancer. The company’s market cap is 17.11M as of 2022 and its ROE is -72.98%. Enedo’s lead candidate, ENED-150, is a targeted therapy that is currently being evaluated in a Phase 1 clinical trial in patients with solid tumors.
– Landis+Gyr Group AG ($LTS:0RTL)
The Landis+Gyr Group AG is a Swiss-based company that focuses on the development and production of products and solutions in the field of energy management. The company has a market capitalization of 1.58 billion as of 2022 and a return on equity of 4.42%. Landis+Gyr is a leading provider of advanced metering, data collection and communication systems for electric, gas and water utilities. The company’s products and solutions are used by utilities around the world to manage energy resources more efficiently, provide better customer service and reduce environmental impact.
– Cyberpower Systems Inc ($TWSE:3617)
Cyberpower Systems Inc is a publicly traded company with a market capitalization of $7.36 billion as of 2022. The company has a return on equity of 6.69%. Cyberpower Systems Inc is engaged in the design, manufacture, and marketing of power protection and power management products, including UPS systems, inverters, surge protectors, and batteries. The company also provides data center solutions, such as data center infrastructure management, server and storage virtualization, and cloud computing solutions.
Summary
VERTIV HOLDINGS reported strong financial results for the second quarter of FY2023, with total revenue increasing by 23.9% year-over-year to USD 1734.1 million and net income increasing significantly from USD 20.3 million to USD 83.2 million. As a result, the stock price of the company rose on the same day. This demonstrates that investors are confident in VERTIV HOLDINGS’s performance, as their financials show positive growth. With this strong second quarter performance, VERTIV HOLDINGS is well-positioned to capitalize on any market growth and maintain their momentum going forward.
Related Posts


Recent Posts


Investing Everyone Can Do.
Investing shouldn’t be exclusive to a select few. We believe everyone should have the opportunity to grow their wealth. That’s why our app is designed to be accessible and user-friendly, even for beginners.
