Union Pacific Reports Q2 Earnings Results for FY2023 on July 26th
July 29, 2023

🌥️Earnings Overview
On July 26, 2023, Union Pacific ($NYSE:UNP) reported their second quarter earnings results for FY2023, ending June 30, 2023. Total revenue had declined 4.9% to $6.0 billion from the same period in the previous year, while net income decreased 14.7% to $1.6 billion.
Stock Price
The stock opened on Wednesday at $236.8 and closed the day at $238.0, a 10.4% increase from its previous closing price of 215.6. The impressive surge in stock value was a result of UNION PACIFIC‘s strong performance over the last quarter. UNION PACIFIC’s strong performance over the second quarter is encouraging for investors, as it demonstrates the company’s ability to generate returns in a challenging market. Overall, UNION PACIFIC has had an impressive second quarter in FY2023.
The stock opened at $236.8 and closed at $238.0, a 10.4% jump from its previous closing price of 215.6. The company reported increases in both net income and total revenue, indicating a strong performance over the last quarter. As a result of its solid financials and consistent dividend payments, UNION PACIFIC is well-positioned to continue generating returns for its investors in the future. Live Quote…
About the Company
Income Snapshot
Below shows the total revenue, net income and net margin for Union Pacific. More…
| Total Revenues | Net Income | Net Margin |
| 24.77k | 6.73k | 26.4% |
Cash Flow Snapshot
Below shows the cash from operations, investing and financing for Union Pacific. More…
| Operations | Investing | Financing |
| 9.05k | -3.6k | -5.42k |
Balance Sheet Snapshot
Below shows the total assets, liabilities and book value per share for Union Pacific. More…
| Total Assets | Total Liabilities | Book Value Per Share |
| 66.03k | 52.84k | 20.43 |
Key Ratios Snapshot
Some of the financial key ratios for Union Pacific are shown below. More…
| 3Y Rev Growth | 3Y Operating Profit Growth | Operating Margin |
| 7.0% | 5.5% | 40.5% |
| FCF Margin | ROE | ROA |
| 22.1% | 50.4% | 9.5% |
Analysis
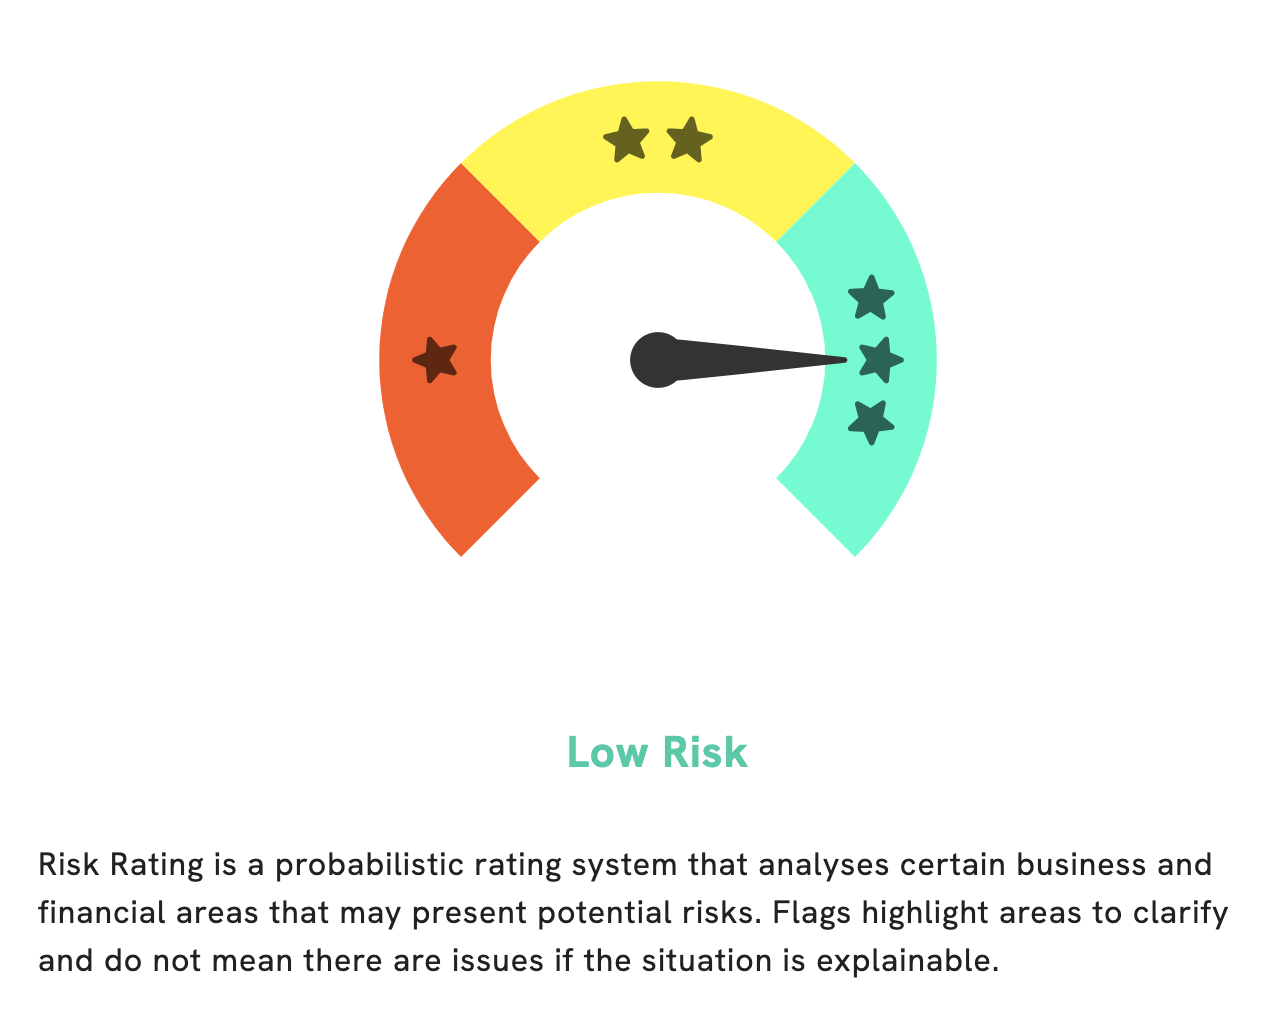
GoodWhale has conducted an analysis of UNION PACIFIC’s wellbeing and detected that it is a low risk investment according to our Risk Rating. The rating is based on both our financial and business assessments. In the balance sheet, we have detected one risk warning. If you are interested in further investigating this warning, please register with us at GoodWhale. Our comprehensive analysis and assessment can provide you with insightful information. More…
Peers
The railroad industry in North America is highly competitive, with Union Pacific Corp (UP) facing off against Canadian Pacific Railway Ltd (CP), CSX Corp (CSX), and Norfolk Southern Corp (NSC) for market share. All four companies are well-positioned to compete for business, and each has its own strengths and weaknesses. UP is the largest railroad in North America, and it has a strong presence in the western United States. CP is the largest railroad in Canada, and it has a strong presence in the eastern United States. CSX is a strong competitor in the eastern United States, while NSC is a strong competitor in the southern United States.
– Canadian Pacific Railway Ltd ($TSX:CP)
Canadian Pacific Railway Ltd. has a market cap of $90.72 billion as of 2022. It has a return on equity of 6.42%. The company operates in the rail transportation industry. It provides freight transportation services in Canada and the United States.
– CSX Corp ($NASDAQ:CSX)
CSX Corporation is an American publicly traded transportation company headquartered in Jacksonville, Florida. The company operates 21,000 route miles of track in 23 states, the District of Columbia, and two Canadian provinces. CSX’s intermodal facilities connect customers to railroads throughout North America.
As of 2022, CSX’s market cap is $57.98 billion and its ROE is 34.03%. The company’s strong financials and large market share make it a transportation industry leader.
– Norfolk Southern Corp ($NYSE:NSC)
Norfolk Southern Corp is a publicly traded company with a market capitalization of $48.12B as of 2022. The company has a strong return on equity of 21.78%. Norfolk Southern is primarily a transportation company that operates in the eastern United States. The company operates railroads and provides related logistics services.
Summary
Investors in Union Pacific have reason to be cautiously optimistic, as the company reported lower but still strong earnings results for Q2 FY2023. Total revenue decreased by 4.9%, but net income still managed to remain above USD 1.6 billion, a decrease of 14.7% year over year. The stock price responded to the news with a positive movement. With strong performance in spite of challenging economic conditions, Union Pacific could be an attractive investment opportunity for those looking to diversify their portfolios.
However, investors should take into account the risks associated with investing in such volatile conditions.


Investing Everyone Can Do.
Investing shouldn’t be exclusive to a select few. We believe everyone should have the opportunity to grow their wealth. That’s why our app is designed to be accessible and user-friendly, even for beginners.
