TFPM Stock Fair Value Calculator – TRIPLE FLAG PRECIOUS METALS Reports Second Quarter FY2023 Earnings Results on August 8, 2023
August 16, 2023

☀️Earnings Overview
On August 8, 2023, TRIPLE FLAG PRECIOUS METALS ($NYSE:TFPM) released its financial results for the second quarter of FY2023, ending June 30, 2023. Total revenue for the quarter was USD 52.6 million, an increase of 44.1% from the same period in the prior year. Net income for this quarter increased 46.8%, to USD 16.0 million.
Price History
The stock opened at $12.6 and closed at $12.8, a decrease of 0.9% from its prior closing price of 12.9. This marked a slight dip in the price of the stock, but overall the company had a strong second quarter with their fiscal year ending in December. This was largely due to the company’s cost-containment efforts and improved operating efficiency. This shows that the company is continuing to become more efficient at managing its costs and improving profits.
Overall, TRIPLE FLAG PRECIOUS METALS had a positive second quarter and looks set to continue to be a strong performer throughout the rest of the fiscal year. The company’s stock may have seen a slight decrease, but its long-term outlook still looks promising. Live Quote…
About the Company
Income Snapshot
Below shows the total revenue, net income and net margin for TFPM. More…
| Total Revenues | Net Income | Net Margin |
| 180.5 | 60.84 | 35.0% |
Cash Flow Snapshot
Below shows the cash from operations, investing and financing for TFPM. More…
| Operations | Investing | Financing |
| 141.82 | -222.73 | 23.1 |
Balance Sheet Snapshot
Below shows the total assets, liabilities and book value per share for TFPM. More…
| Total Assets | Total Liabilities | Book Value Per Share |
| 1.92k | 81.79 | 6.53 |
Key Ratios Snapshot
Some of the financial key ratios for TFPM are shown below. More…
| 3Y Rev Growth | 3Y Operating Profit Growth | Operating Margin |
| 36.9% | 301.9% | 38.8% |
| FCF Margin | ROE | ROA |
| 49.6% | 3.3% | 2.3% |
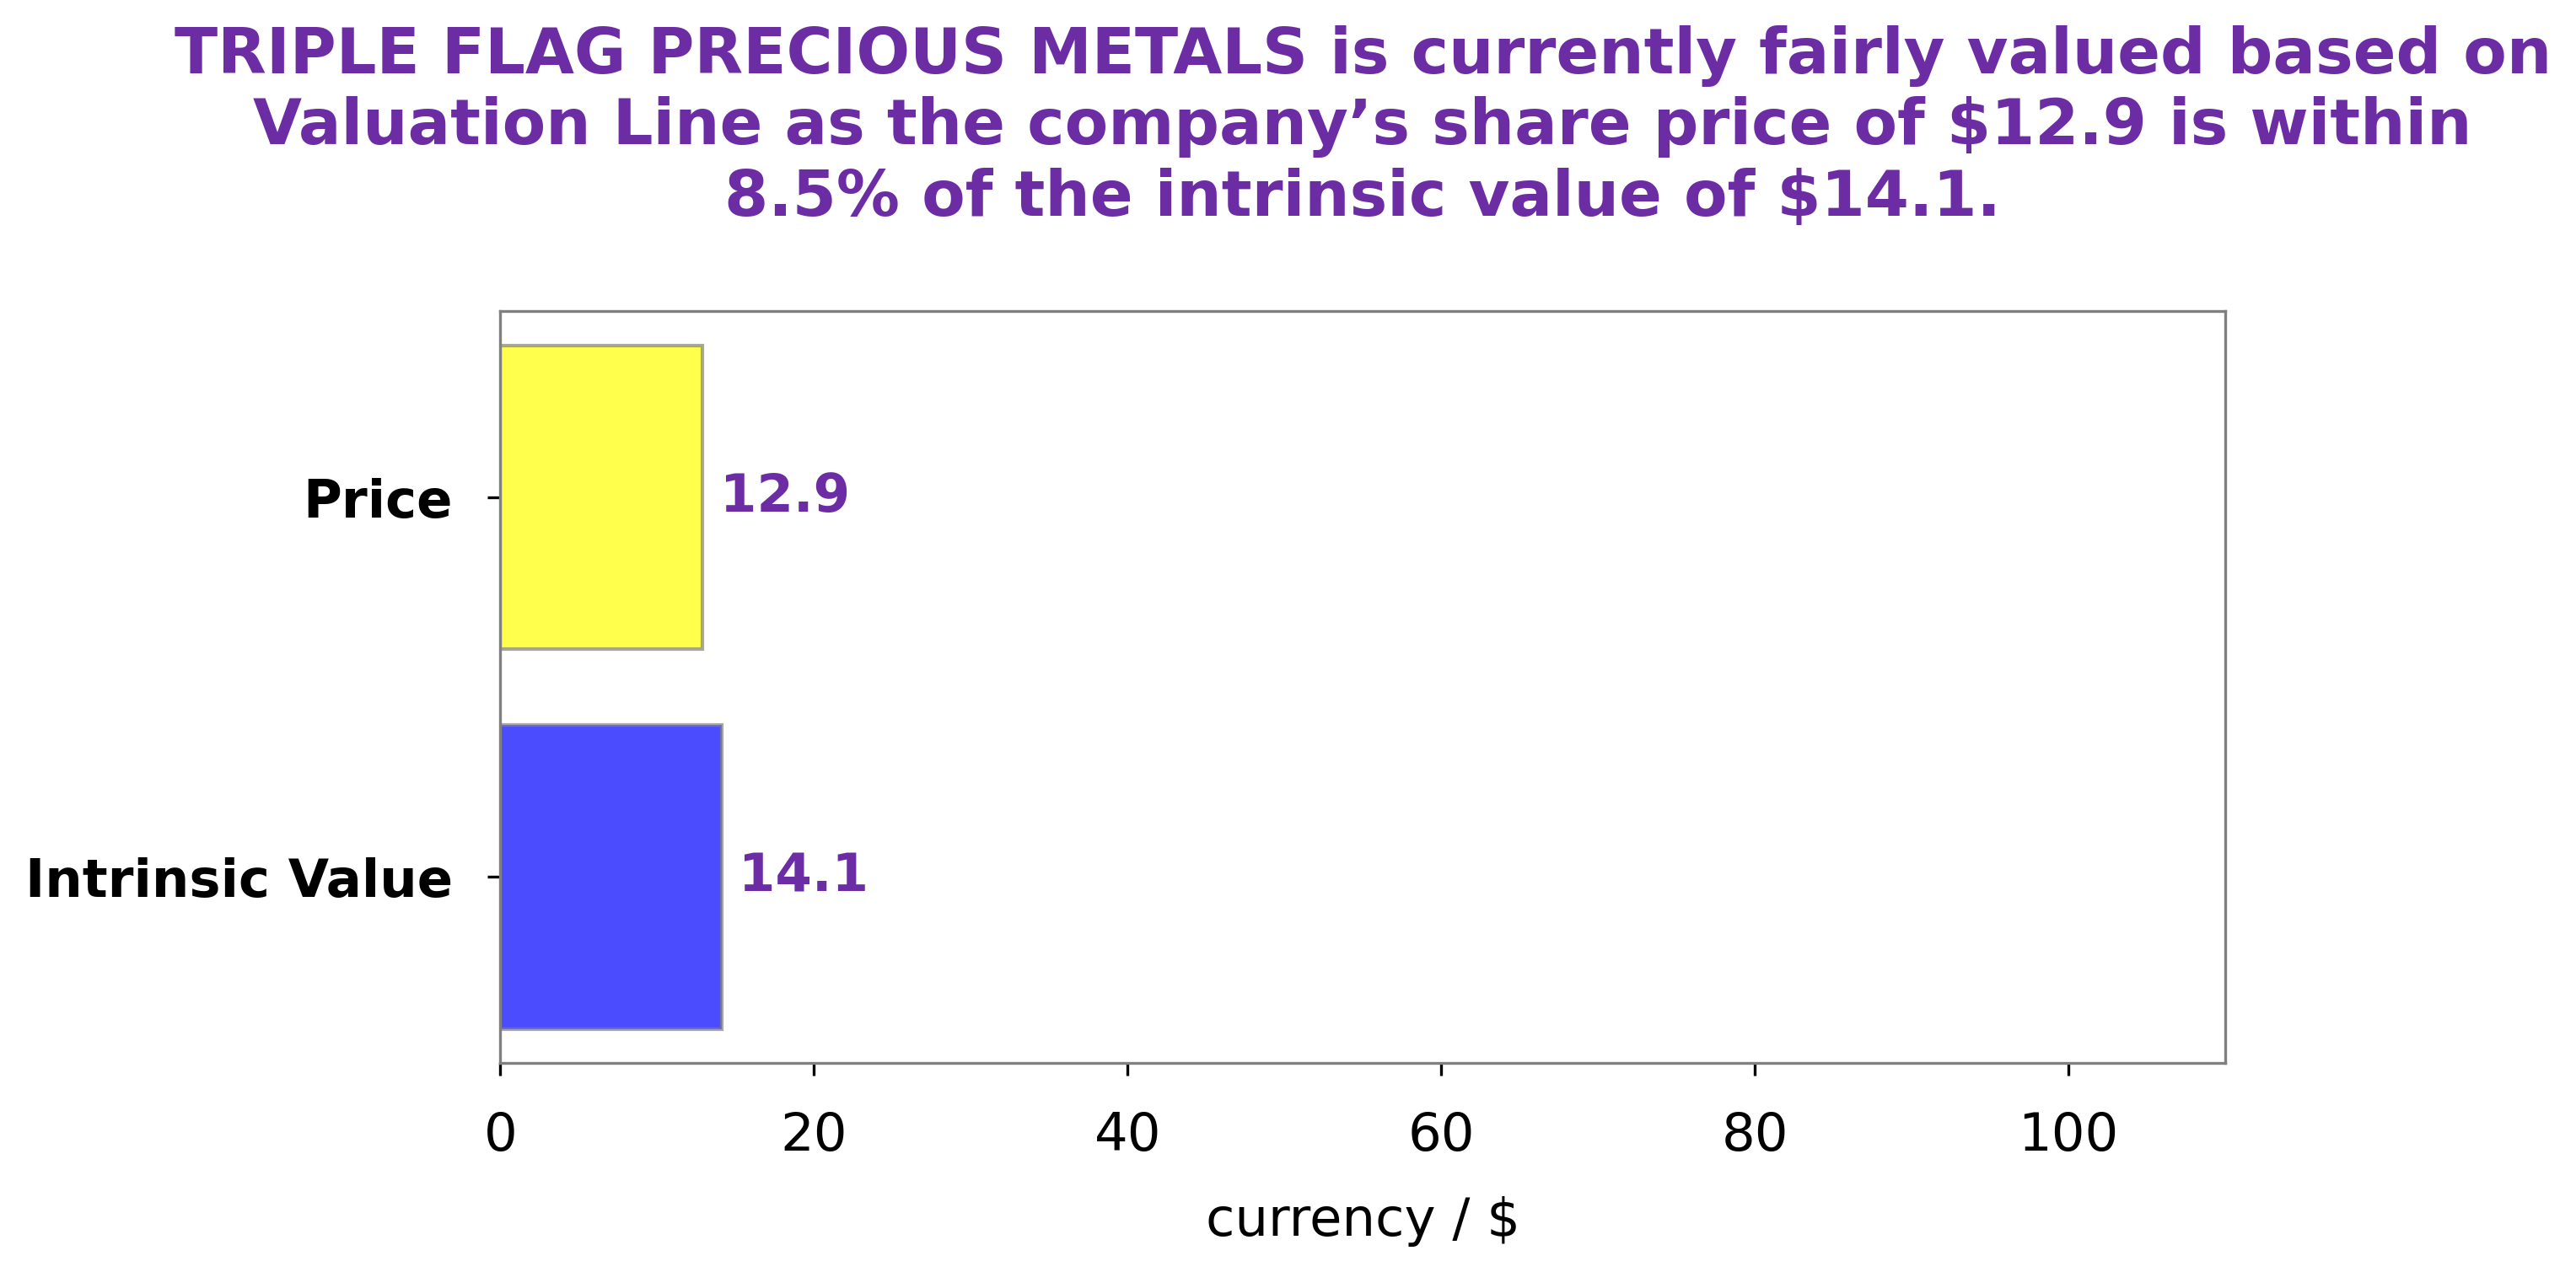
Analysis – TFPM Stock Fair Value Calculator
At GoodWhale, we have conducted an analysis of TRIPLE FLAG PRECIOUS METALS’s financials and our proprietary Valuation Line puts the fair value of its share at around $13.3. Currently, the stock is trading at $12.8, which makes it a fair price but still undervalued by 3.9%. This presents an opportunity for investors looking to buy a good quality stock at a discounted rate. We believe that the stock will eventually reach its fair value, so investors may want to consider buying it now in order to benefit from any potential upside in the future. More…
Summary
TRIPLE FLAG PRECIOUS METALS reported strong earnings results for the second quarter of FY2023, with total revenue of USD 52.6 million and net income of USD 16.0 million, representing increases of 44.1% and 46.8%, respectively, over the same period last year. Analysts suggest that this strong performance is a sign that the company is well positioned for future growth, and investors should take notice. Furthermore, given the company’s impressive revenue and profit figures, it could be an attractive investment opportunity for those looking to diversify their portfolio.
Related Posts


Recent Posts


Investing Everyone Can Do.
Investing shouldn’t be exclusive to a select few. We believe everyone should have the opportunity to grow their wealth. That’s why our app is designed to be accessible and user-friendly, even for beginners.
