Texas Instruments Reports Second Quarter Earnings Results for FY2023
July 28, 2023

🌥️Earnings Overview
On July 25 2023, TEXAS INSTRUMENTS ($NASDAQ:TXN) announced their earnings results for the second quarter of FY2023, which ended on June 30 2023. Their total revenue was USD 4.5 billion, representing a 13.1% decrease from the same quarter the previous year. Net income also decreased 24.9% to USD 1.7 billion, compared to the same period in the prior year.
Market Price
TEXAS INSTRUMENTS opened the day at a price of $185.0 and closed at $186.1, a 1.2% increase from its previous closing price of 183.9. This created an all-time high for the company and further strengthened its portfolio position in the technology sector. This uplifting news was met with a resounding positive response from the stock market and investors alike. The impressive growth in stock price and revenue paint a promising picture for the company’s future outlook and its ability to remain competitive in the industry. Live Quote…
About the Company
Income Snapshot
Below shows the total revenue, net income and net margin for Texas Instruments. More…
| Total Revenues | Net Income | Net Margin |
| 18.82k | 7.65k | 41.4% |
Cash Flow Snapshot
Below shows the cash from operations, investing and financing for Texas Instruments. More…
| Operations | Investing | Financing |
| 7.37k | -5.5k | -2.23k |
Balance Sheet Snapshot
Below shows the total assets, liabilities and book value per share for Texas Instruments. More…
| Total Assets | Total Liabilities | Book Value Per Share |
| 30.94k | 15k | 17.56 |
Key Ratios Snapshot
Some of the financial key ratios for Texas Instruments are shown below. More…
| 3Y Rev Growth | 3Y Operating Profit Growth | Operating Margin |
| 11.2% | 16.9% | 48.0% |
| FCF Margin | ROE | ROA |
| 16.9% | 36.2% | 18.3% |
Analysis
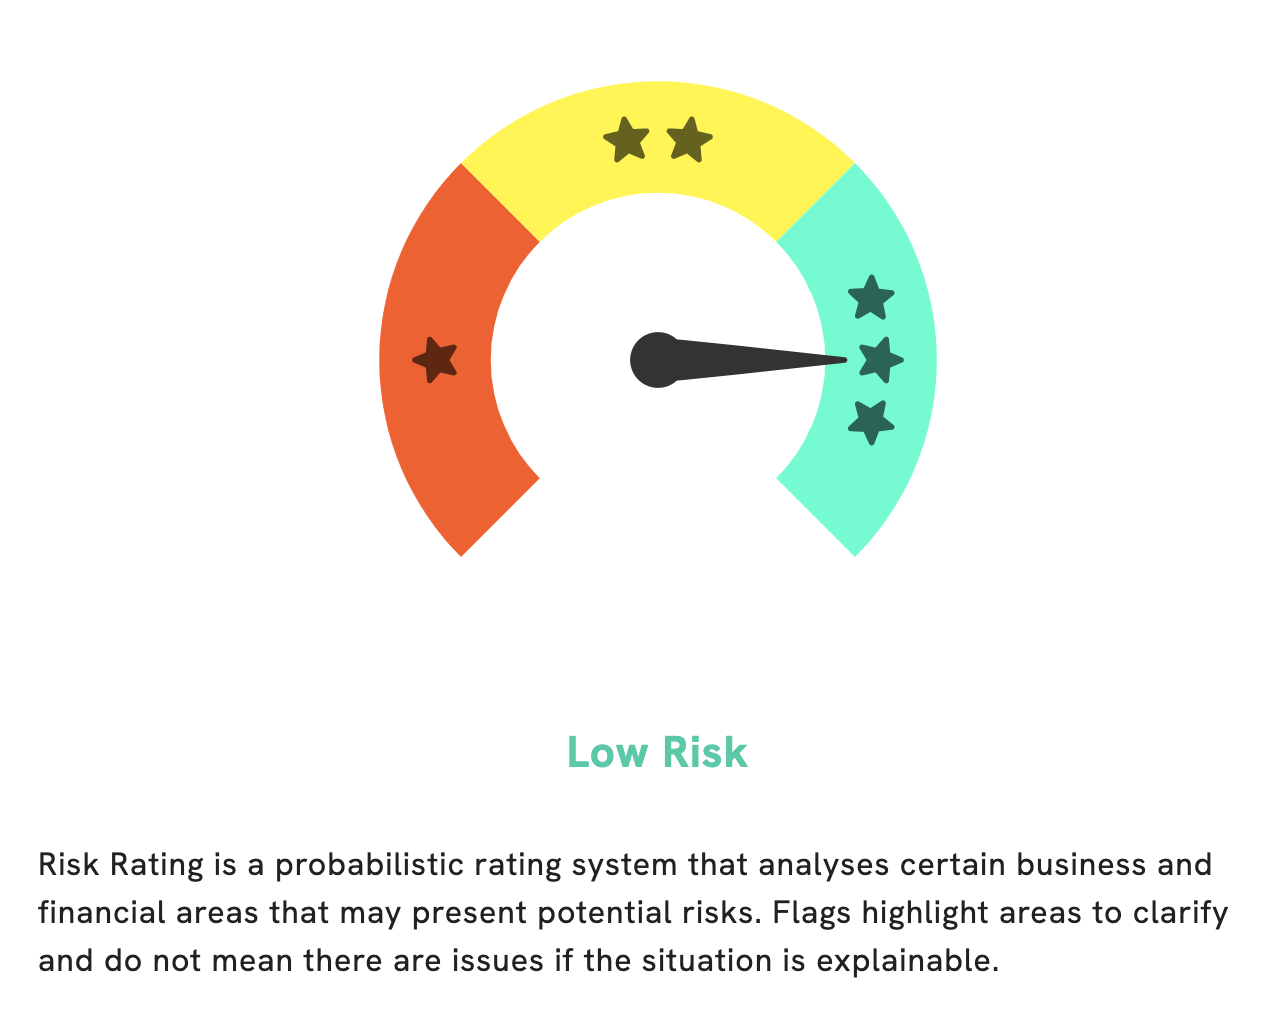
At GoodWhale, we recently conducted an analysis of the financials of Texas Instruments. Upon examining their financials, we determined that Texas Instruments is a low risk investment in terms of both its financial and business aspects. Our analysis revealed two risk warnings in its income sheet and balance sheet. To give you a better understanding of these risk warnings, we urge you to register with us and check it out. Our analysis offers an in-depth look at the financials of Texas Instruments, thereby giving you the opportunity to make a more informed decision regarding your investments. At GoodWhale, we understand that when it comes to investments, it always pays to be well-informed. That’s why we are committed to providing you with the most comprehensive and up-to-date financial analysis on Texas Instruments. We strive to offer both accurate and timely information so you can make the best decision for your investments. More…
Peers
Texas Instruments Inc is one of the leading semiconductor companies in the world. Its competitors include SK Hynix Inc, Silergy Corp, and SPEL Semiconductor Ltd. Texas Instruments has a wide range of semiconductor products that are used in a variety of electronic devices.
– SK Hynix Inc ($KOSE:000660)
SK Hynix Inc is a South Korean company that manufactures and markets semiconductor memory products. The company has a market capitalization of $63.88 trillion as of 2022 and a return on equity of 15.68%. SK Hynix is the world’s second-largest manufacturer of dynamic random-access memory (DRAM) chips and the fifth-largest manufacturer of NAND flash memory chips. The company’s products are used in a variety of electronic devices, including computers, mobile phones, digital cameras, and game consoles.
– Silergy Corp ($TWSE:6415)
Silergy Corp is a global leader in the development and manufacture of high-performance, energy-efficient semiconductor solutions. The company’s products are used in a variety of applications, including mobile devices, computing, networking, and storage. Silergy Corp has a market cap of 159.26B as of 2022, a Return on Equity of 18.65%. The company’s products are used in a variety of applications, including mobile devices, computing, networking, and storage.
– SPEL Semiconductor Ltd ($BSE:517166)
SPEL Semiconductor Ltd is a fabless semiconductor company that designs, develops, and markets analog and mixed-signal integrated circuits (ICs) for a range of applications in the automotive, industrial, consumer, and computing markets. The company has a market cap of 2.66B as of 2022 and a Return on Equity of -6.07%. SPEL’s products include power management ICs, audio ICs, motor control ICs, and LED driver ICs. The company was founded in 1995 and is headquartered in Noida, India.
Summary
Texas Instruments reported mixed financial results for the second quarter of FY2023. Total revenue decreased 13.1% year-over-year to $4.5 billion, while net income fell 24.9% year-over-year to $1.7 billion. Despite the overall decrease, investors should note that TI’s revenue and profits are still considerable and that the company’s financial position remains strong.
Looking ahead, TI is focused on reducing costs, driving efficiency, and improving product performance. Investors should also consider the potential of the company’s current markets and the impact of any new products or services in the pipeline.
Related Posts


Recent Posts


Investing Everyone Can Do.
Investing shouldn’t be exclusive to a select few. We believe everyone should have the opportunity to grow their wealth. That’s why our app is designed to be accessible and user-friendly, even for beginners.
