TENABLE HOLDINGS Reports Q2 FY2023 Financial Results for June 30 2023
August 3, 2023

🌥️Earnings Overview
On July 25, 2023, TENABLE HOLDINGS ($NASDAQ:TENB) reported its financial results for the second quarter of FY2023, which ended on June 30, 2023. The company experienced a total revenue of USD 195.0 million, representing an 18.7% year-over-year increase. Additionally, the reported net income was USD -16.0 million, an improvement from the -27.5 million reported in the same period of the previous year.
Share Price
On Tuesday, TENABLE HOLDINGS reported its financial results for the second quarter of FY2023, which ended on June 30, 2023. The stock opened at $43.3 and closed at $43.8, up by 1.0% from previous closing price of 43.3. This was mainly driven by a surge in demand for the company’s software products and services, as customers looked to improve their cybersecurity posture amid a rapidly changing and increasingly digital world. The dividend is payable on August 16, 2023 to shareholders of record as of August 2, 2023.
TENABLE HOLDINGS CEO Amit Yoran expressed his satisfaction with the company’s performance, saying “We are very pleased with our strong financial performance in the second quarter, driven by continued strong demand for our portfolio of cybersecurity solutions and our ability to execute on our long-term strategies. We remain focused on helping organizations around the world secure their digital assets and achieve their cybersecurity goals.” Live Quote…
About the Company
Income Snapshot
Below shows the total revenue, net income and net margin for Tenable Holdings. More…
| Total Revenues | Net Income | Net Margin |
| 743.36 | -81.29 | -10.9% |
Cash Flow Snapshot
Below shows the cash from operations, investing and financing for Tenable Holdings. More…
| Operations | Investing | Financing |
| 136.71 | -43.31 | 16.94 |
Balance Sheet Snapshot
Below shows the total assets, liabilities and book value per share for Tenable Holdings. More…
| Total Assets | Total Liabilities | Book Value Per Share |
| 1.47k | 1.15k | 2.74 |
Key Ratios Snapshot
Some of the financial key ratios for Tenable Holdings are shown below. More…
| 3Y Rev Growth | 3Y Operating Profit Growth | Operating Margin |
| 23.1% | – | -5.7% |
| FCF Margin | ROE | ROA |
| 16.6% | -8.8% | -1.8% |
Analysis
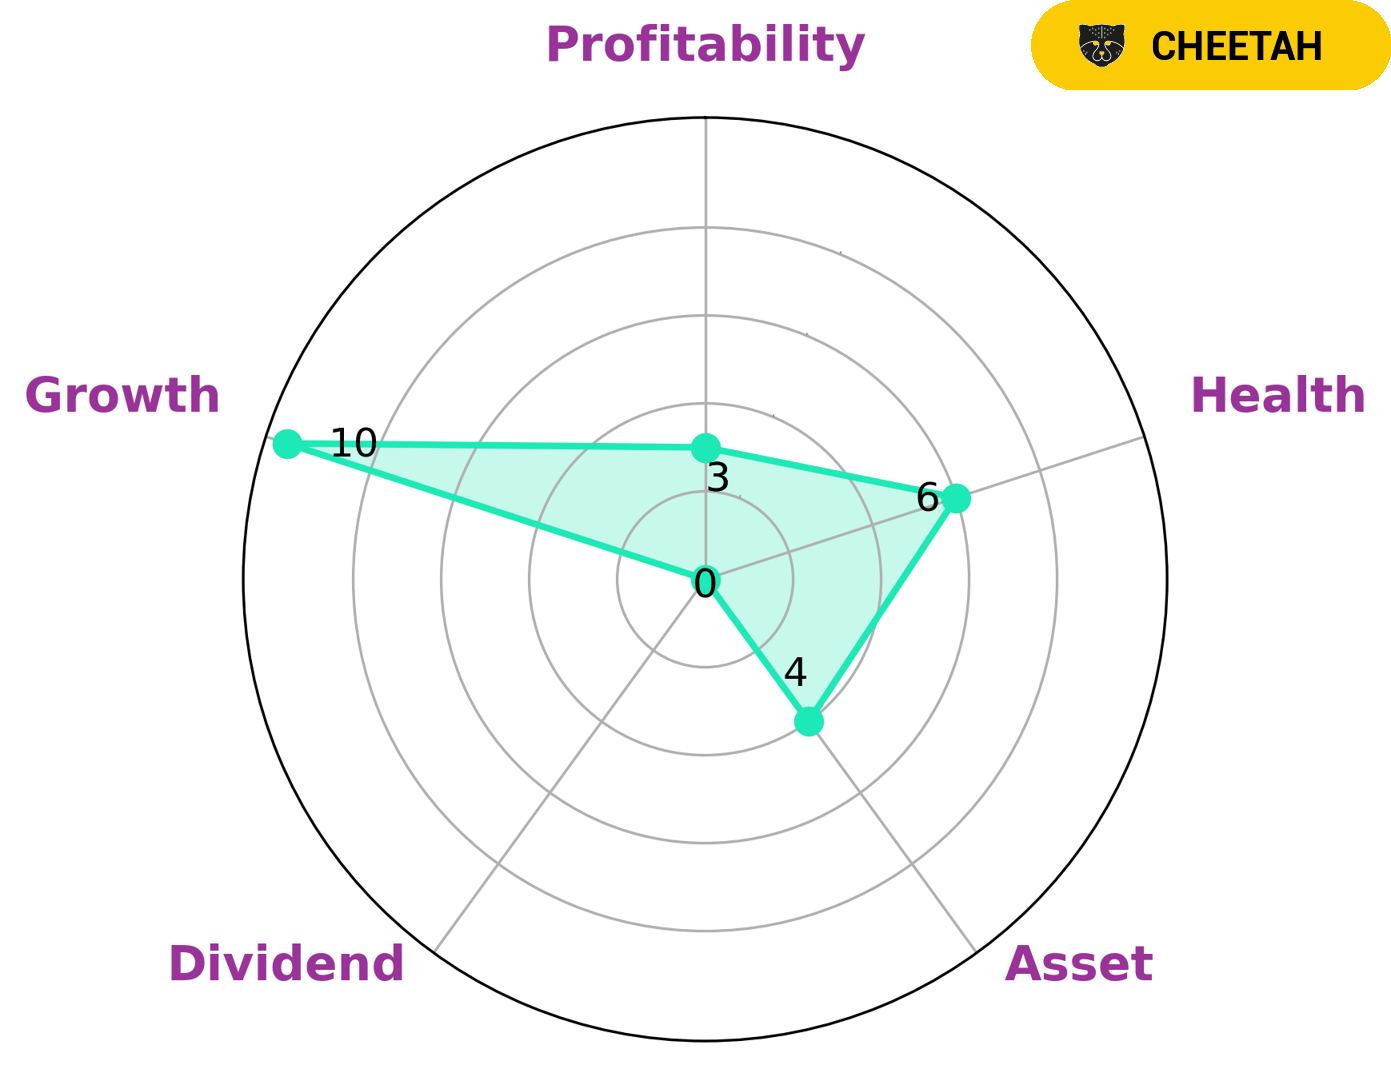
GoodWhale has conducted an analysis of TENABLE HOLDINGS‘s fundamentals. According to Star Chart, TENABLE HOLDINGS has an intermediate health score of 5/10 with regard to its cashflows and debt, indicating that it might be able to sustain future operations in times of crisis. We have classified TENABLE HOLDINGS as ‘cheetah’, a type of company that has achieved high revenue or earnings growth but is considered less stable due to lower profitability. Given this assessment, investors interested in TENABLE HOLDINGS would need to weigh the upside potential from its rapid growth with the risk of its less reliable balance sheet. On the one hand, TENABLE HOLDINGS is strong in growth, medium in asset and weak in dividend, profitability. On the other hand, the company has an intermediate health score which could pose potential risks. Therefore, investors should consider the relative risk-reward ratio before investing in TENABLE HOLDINGS. More…
Peers
Tenable was founded in 2002 by Jack Huffard, Ron Gula, and Marcus Ranum. Tenable went public in July 2018, and trades on the NASDAQ under the symbol TENB. Tenable delivers Tenable.io, the world’s first Cyber Exposure platform, as well as a suite of award-winning products including the Nessus vulnerability scanner. Tenable.io provides continuous visibility into an organization’s cyber exposure across their entire attack surface, from operating systems and hardware to virtualization and cloud environments and containers. By identifying and prioritizing vulnerabilities and configurations issues, Tenable.io helps organizations to fix critical issues before they can be exploited. In addition to Tenable.io, Tenable also offers a suite of products that includes the Nessus vulnerability scanner, which is used by more than 1.5 million users in over 150 countries. Nessus is available in a variety of editions, including a free edition, and is used by small businesses, Fortune 500 companies, government agencies, and many of the world’s leading service providers.
– Indra Sistemas SA ($OTCPK:ISMAY)
Indra Sistemas SA is a Spanish company that provides technology solutions for defense, security, and transportation. As of 2022, the company has a market capitalization of 1.7 billion euros and a return on equity of 18.37%. Indra Sistemas SA is a leading provider of technology solutions for the defense, security, and transportation markets. The company has a strong presence in Spain and Europe, and is expanding its operations in Asia and the Americas.
– Check Point Software Technologies Ltd ($NASDAQ:CHKP)
Check Point Software Technologies Ltd is a software company that provides internet security solutions. Its products include firewall products, anti-virus software, and intrusion detection systems. The company has a market cap of 16.5B as of 2022 and a Return on Equity of 18.44%. Check Point Software Technologies is headquartered in Tel Aviv, Israel.
– Cyber Security 1 AB ($LTS:0GCB)
Cyber Security 1 AB is a Swedish company that specializes in providing cyber security solutions. The company has a market capitalization of 16.14 million as of 2022 and a return on equity of -11.14%. Cyber Security 1 AB’s solutions include intrusion detection and prevention, vulnerability management, and security information and event management. The company serves a range of industries, including government, healthcare, finance, and retail.
Summary
TENABLE HOLDINGS‘ financial results for the second quarter of FY2023, ending June 30 2023, showed strong growth in revenue and profitability. Total revenue came in at USD 195.0 million, up 18.7% compared to the same period of the previous year. Net income was USD -16.0 million, a significant improvement from the prior year’s figure of -27.5 million.
As a result, investors may view TENABLE HOLDINGS as a good investment opportunity, with potential for further upside in the coming quarters. The company’s strong financial performance and potential for continued growth should continue to provide an attractive return on investment for investors.
Related Posts


Recent Posts


Investing Everyone Can Do.
Investing shouldn’t be exclusive to a select few. We believe everyone should have the opportunity to grow their wealth. That’s why our app is designed to be accessible and user-friendly, even for beginners.
