SUNEX SA Reports 78.9% Increase in Total Revenue for First Three Months of FY2023
May 28, 2023

Earnings Overview
SUNEX SA ($LTS:0R9W) reported total revenue of PLN 100.5 million for the first three months of FY2023, an increase of 78.9% when compared to the same period in FY2022. The company’s net income also rose 64.6%, reaching PLN 9.7 million by March 31, 2023.
Analysis
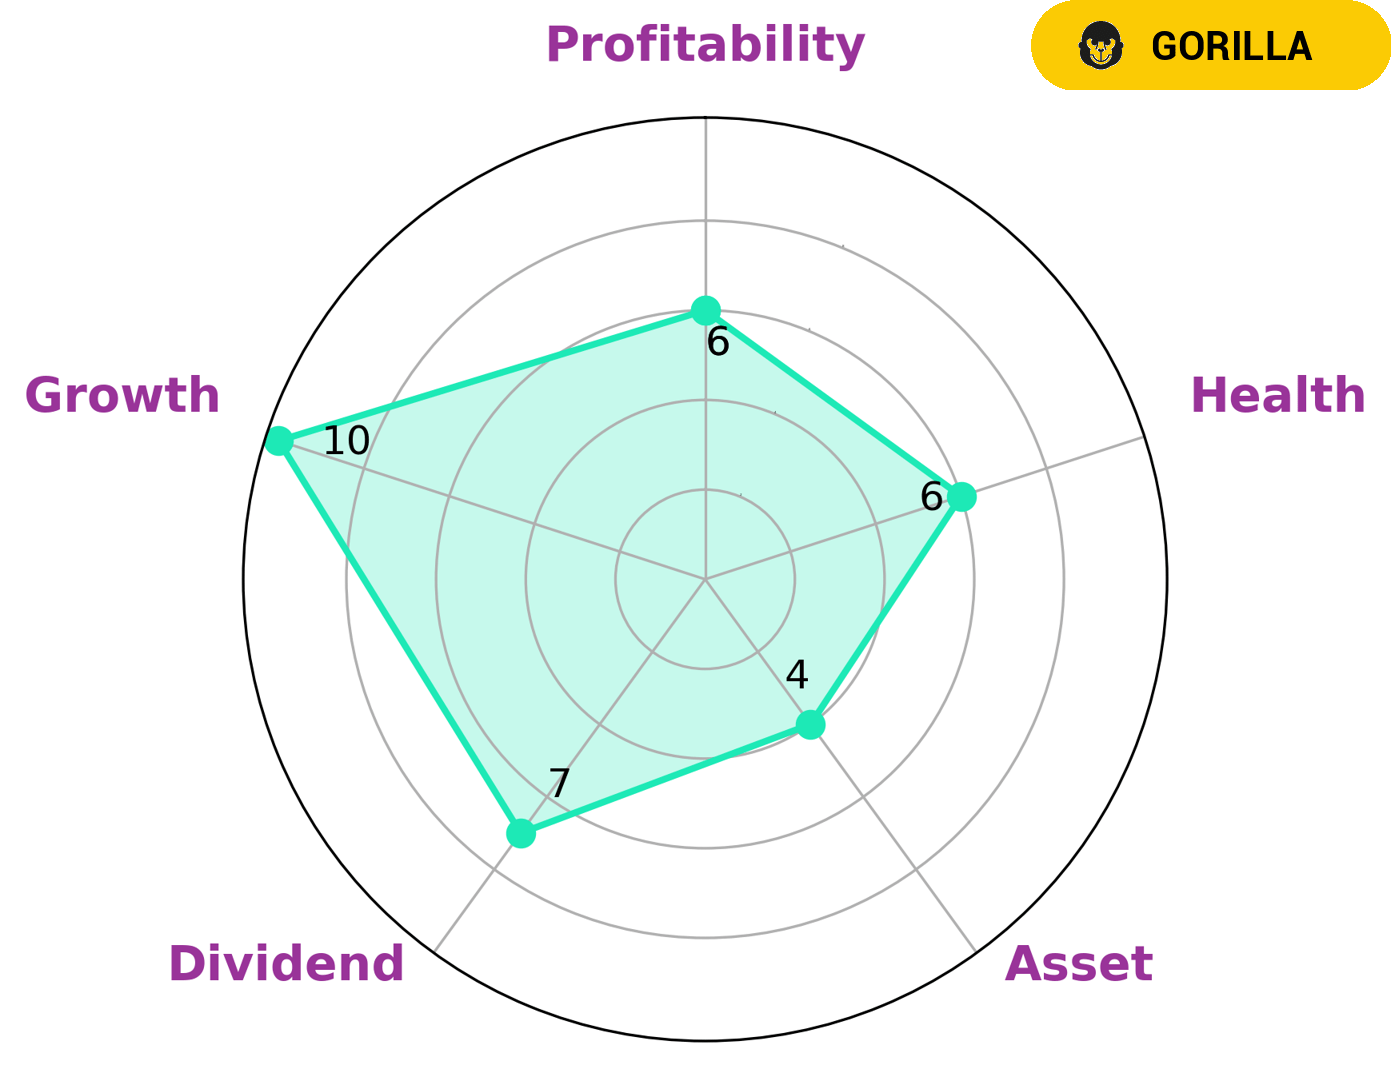
GoodWhale conducted an analysis of SUNEX SA‘s wellbeing and the results of the Star Chart showed that SUNEX SA is strong in dividend and growth, and medium in asset and profitability. Additionally, the company has an intermediate health score of 6/10 with regard to its cashflows and debt, indicating that it might be able to sustain future operations even in times of crisis. SUNEX SA is classified as a ‘gorilla’, a type of company that has achieved stable and high revenue or earning growth due to its strong competitive advantage. Investors interested in such a company may include those looking for investments with reliable returns and those who have a long-term investment horizon. Furthermore, they may also seek out companies whose operations are relatively resilient to changing market conditions. More…
About the Company
Income Snapshot
Below shows the total revenue, net income and net margin for Sunex Sa. More…
| Total Revenues | Net Income | Net Margin |
| 333.86 | 42.79 | 12.9% |
Cash Flow Snapshot
Below shows the cash from operations, investing and financing for Sunex Sa. More…
| Operations | Investing | Financing |
| 13.5 | -1.92 | 34.87 |
Balance Sheet Snapshot
Below shows the total assets, liabilities and book value per share for Sunex Sa. More…
| Total Assets | Total Liabilities | Book Value Per Share |
| 279.76 | 189.92 | 3.95 |
Key Ratios Snapshot
Some of the financial key ratios for Sunex Sa are shown below. More…
| 3Y Rev Growth | 3Y Operating Profit Growth | Operating Margin |
| 70.3% | 119.5% | 16.4% |
| FCF Margin | ROE | ROA |
| 0.8% | 40.2% | 12.2% |
Peers
Sunex SA is an international solar energy company that provides innovative renewable energy solutions to meet the growing demand for clean, sustainable power. It is a leading provider of solar energy solutions and services, and has a growing presence in the US and Europe. Sunex SA competes in the solar energy market with Sunrun Inc, Solareast Holdings Co Ltd, and ABCO Energy Inc. These companies all strive to provide reliable and cost-effective solar energy solutions to their customers.
– Sunrun Inc ($NASDAQ:RUN)
Sunrun Inc is a leading residential solar, storage and energy services company in the United States. The company provides solar energy services to homeowners, allowing them to save money on their monthly electricity bills. As of 2022, Sunrun Inc has a market cap of 5.06 billion and a return on equity of -3.98%. This suggests that the company is not generating returns for its shareholders. Sunrun Inc has been investing in research and development to drive growth, expand its product offerings and increase efficiencies. The company has also been actively expanding its operations across the United States and is also expanding internationally.
– Solareast Holdings Co Ltd ($SHSE:603366)
Solareast Holdings Co Ltd is a leading provider of energy and power solutions in China. The company focuses on the development, manufacture, sale, and service of solar energy, wind power, and other renewable energy related products. As of 2022, the company has a market capitalization of 5.06 billion, making it one of the largest companies in the energy and power industry in China. Additionally, its Return on Equity (ROE) is 2.96%, suggesting a good level of profitability from its investments and activities. Overall, Solareast Holdings Co Ltd is a strong competitor in the Chinese energy and power industry.
– ABCO Energy Inc ($OTCPK:ABCE)
ABCO Energy Inc is an American publicly traded company that provides energy solutions to residential, commercial, and industrial customers. The company has a market capitalization of 416.82k as of 2022, which is a measure of the company’s size and reflects the total value of its outstanding shares. Additionally, ABCO Energy Inc has a Return on Equity of 23.52%, which indicates that the company is generating more profits on its investments than it is paying out in costs and expenses. This strong performance reflects the company’s ability to generate more revenue with its investments and is a sign of its financial health.
Summary
Investment analysis of SUNEX SA for the first three months of FY2023 is highly positive. Total revenue increased 78.9% compared to the same period in the previous year, reaching PLN 100.5 million. Net income rose 64.6%, reaching PLN 9.7 million.
This strong financial performance is a sign of the company’s success and suggests a potential growth in stock value. Investors should keep a close watch on the company’s future developments to determine whether to invest or not.
Related Posts


Recent Posts


