SOLO BRANDS Reports Q2 Earnings Results for FY2023
August 7, 2023

🌥️Earnings Overview
For the second quarter of the 2023 fiscal year, which ended on June 30, SOLO BRANDS ($NYSE:DTC) reported total revenue of USD 130.9 million, representing a 3.7% decline compared to the same period in the prior year. Although revenue decreased, net income surged 161.6% to USD 7.4 million.
Price History
SOLO BRANDS reported their Q2 earnings results for FY2023 on Thursday. The stock opened at $5.6 and closed at $5.8, representing an increase of 4.3% from the previous closing price of $5.6. SOLO BRANDS’ Q2 earnings report revealed strong performance across key operating metrics, with improved year-over-year revenue growth, increased profitability, and a positive outlook for the remainder of the fiscal year. The company’s solid performance was largely driven by growth in its new product lines, which have been very well received by customers.
Additionally, SOLO BRANDS has made significant investments in new technology, customer service, and marketing initiatives over the past quarter, which has positively impacted overall profitability and sales. Going forward, SOLO BRANDS will continue to focus on expanding its market share and introducing innovative products in order to remain competitive in the marketplace. The company is confident that its strategy will result in continued growth and profitability throughout the remainder of FY2023 and beyond. Live Quote…
About the Company
Income Snapshot
Below shows the total revenue, net income and net margin for Solo Brands. More…
| Total Revenues | Net Income | Net Margin |
| 518.54 | 17.48 | 3.4% |
Cash Flow Snapshot
Below shows the cash from operations, investing and financing for Solo Brands. More…
| Operations | Investing | Financing |
| 96.1 | -13.55 | -48.34 |
Balance Sheet Snapshot
Below shows the total assets, liabilities and book value per share for Solo Brands. More…
| Total Assets | Total Liabilities | Book Value Per Share |
| 881.17 | 298.02 | 6.15 |
Key Ratios Snapshot
Some of the financial key ratios for Solo Brands are shown below. More…
| 3Y Rev Growth | 3Y Operating Profit Growth | Operating Margin |
| 135.1% | – | 14.4% |
| FCF Margin | ROE | ROA |
| 17.0% | 12.9% | 5.3% |
Analysis
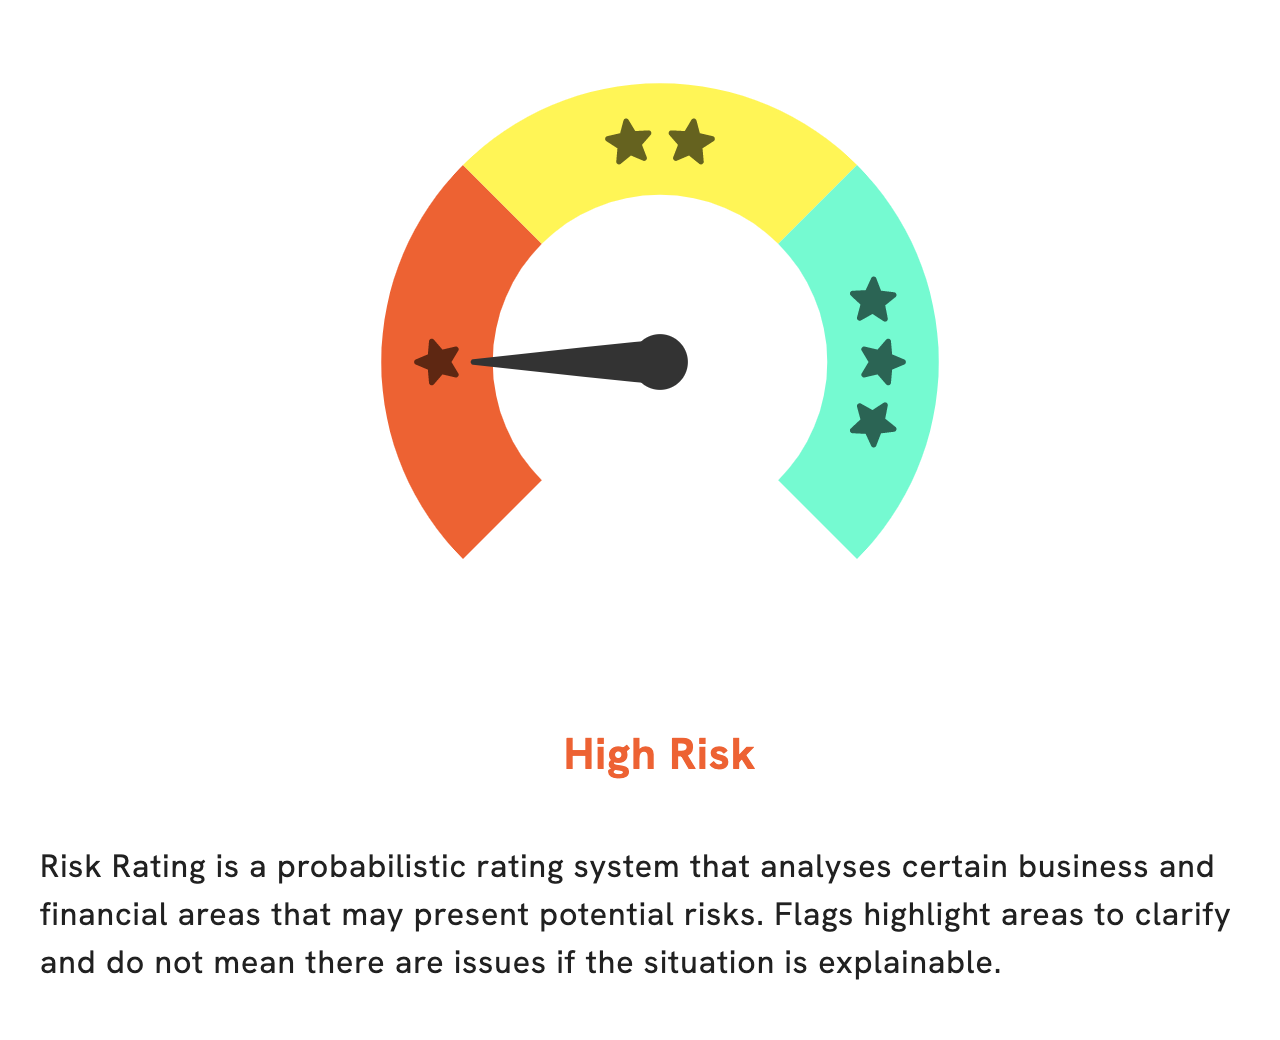
As GoodWhale, our analysis of SOLO BRANDS‘ financials has revealed that it is a high risk investment in terms of both financial and business aspects. We found two risk warnings in the balance sheet and cash flow statement, which can be checked on goodwhale.com. We believe investors should take these risks into account before making any decisions on the company. At GoodWhale, we strive to provide comprehensive information to enable our clients to make informed investment decisions. Our analysis includes data from the balance sheet and cash flow statement, as well as financial and business risk ratings. With these detailed data points, we hope to help investors make the best choices for their portfolios. More…
Peers
In the current market, there are many companies that provide similar products and services vying for the top spot. Among these companies are Solo Brands Inc, Kid Brands Inc, Poshmark Inc, and Rent the Runway Inc. All of these companies offer unique products and services that appeal to different demographics, making the competition between them fierce. In order to stay ahead of the competition, Solo Brands Inc must continue to produce high-quality products that meet the needs and wants of its target market. Additionally, Solo Brands Inc must also focus on marketing its products in a way that sets it apart from its competitors.
– Kid Brands Inc ($OTCPK:KIDBQ)
Kid Brands Inc is a toy company that designs, manufactures, and markets children’s toys and related products. The company has a market capitalization of $24.36 million and a return on equity of 520.64%. Kid Brands Inc’s products include dolls, action figures, plush toys, and educational toys. The company sells its products through retailers, distributors, and e-commerce platforms.
– Poshmark Inc ($NASDAQ:POSH)
Poshmark is a social commerce company that enables people to buy and sell fashion items. As of 2022, it has a market cap of 1.41B and a ROE of -9.05%. The company was founded in 2011 and is headquartered in Redwood City, California. Poshmark allows users to list items from their closets and sell them to other users. It also provides users with a platform to connect with other users and share fashion tips and trends.
– Rent the Runway Inc ($NASDAQ:RENT)
Rent the Runway Inc is a company that provides rental and subscription services for designer apparel and accessories. As of 2022, the company has a market capitalization of 118.73 million and a return on equity of -403.22%. The company was founded in 2009 and is headquartered in New York, New York.
Summary
SOLO BRANDS reported an overall 3.7% decrease in total revenue for Q2 of FY2023, ending June 30, 2023. Despite this decrease, net income for the quarter increased a substantial 161.6%, amounting to USD 7.4 million. On the news of these results, SOLO BRANDS’ stock price rose the same day.
For investors, this increase in net income and stock price could be an encouraging sign of the company’s success and prospects. It is important to continue monitoring SOLO BRANDS’ performance to determine if the current market situation is a sign of a secure investment or a risk.
Related Posts


Recent Posts


Investing Everyone Can Do.
Investing shouldn’t be exclusive to a select few. We believe everyone should have the opportunity to grow their wealth. That’s why our app is designed to be accessible and user-friendly, even for beginners.
