LINDBLAD EXPEDITIONS Reports Fourth Quarter FY2022 Earnings Results for December 31, 2022
March 30, 2023

Earnings Overview
On February 28, 2023, LINDBLAD EXPEDITIONS ($NASDAQ:LIND) reported their earnings results for the fourth quarter of FY2022, ending December 31, 2022. Their total revenue decreased 22.2% year-over-year to USD -32.2 million, yet their net income rose 80.0% to USD 118.0 million.
Transcripts Simplified
Total company revenue for the full year 2022 of $421 million increased $274 million versus 2021 and was $78 million or 23% higher than 2019, due in large part to our expanded fleet and additional land-focused offerings. Occupancy in the year was 75%. Revenue at the Land Experiences segment for the full year 2022 of $143 million was more than double 2021, as well as double 2019, as guests returned to traveling and experienced our immersive trips.
Adjusted EBITDA in 2022 was a loss of $11 million as positive EBITDA of $18 million from our Land Experiences segment was more than offset by losses of $29 million at the Lindblad segment. The Lindblad segment EBITDA loss was a $38 million improvement from the full year 2021, demonstrating the strong operating leverage inherent in our business model.
About the Company
Income Snapshot
Below shows the total revenue, net income and net margin for Lindblad Expeditions. More…
| Total Revenues | Net Income | Net Margin |
| 421.5 | -116.05 | -26.2% |
Cash Flow Snapshot
Below shows the cash from operations, investing and financing for Lindblad Expeditions. More…
| Operations | Investing | Financing |
| -2.2 | -49.59 | -4.87 |
Balance Sheet Snapshot
Below shows the total assets, liabilities and book value per share for Lindblad Expeditions. More…
| Total Assets | Total Liabilities | Book Value Per Share |
| 787.98 | 873.62 | -2.14 |
Key Ratios Snapshot
Some of the financial key ratios for Lindblad Expeditions are shown below. More…
| 3Y Rev Growth | 3Y Operating Profit Growth | Operating Margin |
| 7.1% | 33.4% | -15.3% |
| FCF Margin | ROE | ROA |
| -9.6% | 40.3% | -5.1% |
Market Price
The company saw their stock open at $10.4 and close at $8.6, a 20.0% plunge from their prior closing price of 10.7. This marked a significant downturn in the stock’s value and could come as a surprise to many investors after LINDBLAD EXPEDITIONS had posted positive returns in the previous quarter. The company has yet to announce what factors may be behind the sudden drop. Analysts have suggested that the new tariffs announced by the U.S. government earlier this year may have had an impact on the company’s ability to produce or source materials for their business operations.
Additionally, LINDBLAD EXPEDITIONS may be feeling the effects of delayed or cancelled travel plans caused by the ongoing pandemic. It remains to be seen whether or not LINDBLAD EXPEDITIONS can bounce back from these earnings results and return to profitability. While the news was not welcome on Tuesday, investors are hopeful that the company can find a way to turn things around in the near future. Live Quote…
Analysis
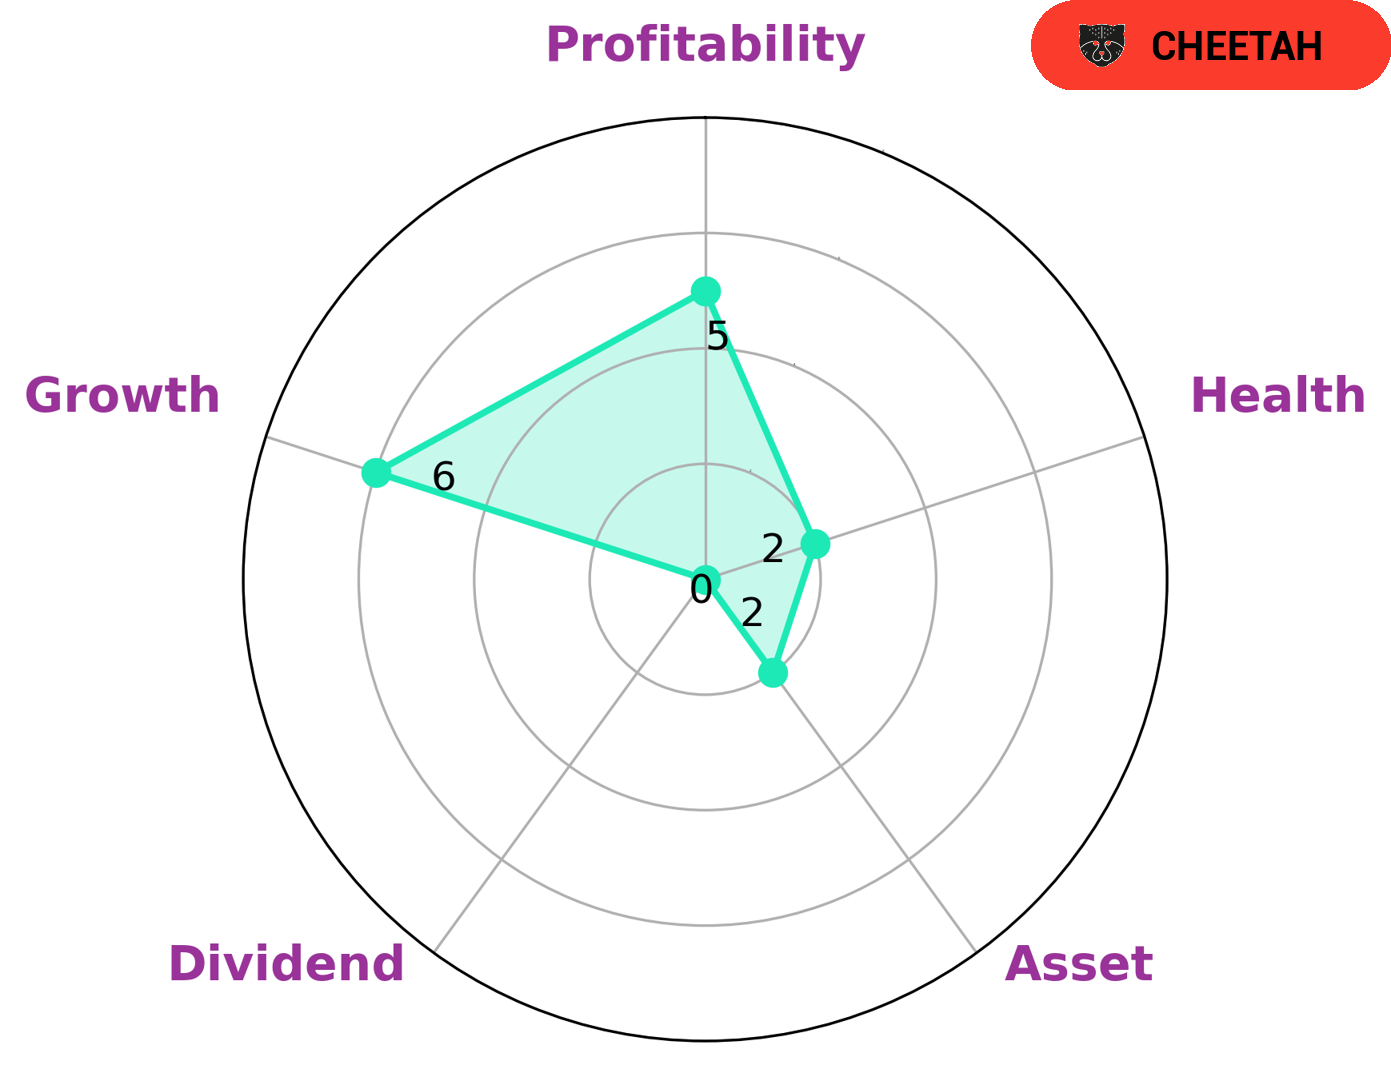
GoodWhale recently completed an analysis of LINDBLAD EXPEDITIONS’ wellbeing. Our Star Chart, which shows a comprehensive picture of the company’s finances, showed that LINDBLAD EXPEDITIONS had a rather low health score of 2/10 with regard to its cashflows and debt. This indicates that, considering its current financial position, the company is less likely to be able to pay off its debt and fund future operations. Further analysis revealed that LINDBLAD EXPEDITIONS is strong in terms of medium growth and profitability, and weak in terms of assets and dividend. This led us to classify the company as a ‘cheetah’, a type of company that has achieved high revenue or earnings growth, but is considered less stable due to lower profitability. Given this information, we believe that the type of investors who would be interested in LINDBLAD EXPEDITIONS are those looking for short-term gains, as the company’s higher revenue or earnings growth could lead to quick returns. However, these investors should be aware that there is some risk associated with the company due to its lower profitability and weaker asset base. More…
Peers
The company specializes in adventure travel and expedition cruises. The company was founded in 1979 and is headquartered in New York City. The company has a market capitalization of $1.02 billion as of May 2020. The company has a fleet of 13 ships and operates in over 50 countries. PT Panorama Sentrawisata Tbk is a publicly traded company that operates in the tourism industry. The company specializes in inbound and outbound tourism, as well as hotel management. The company was founded in 1980 and is headquartered in Jakarta, Indonesia. The company has a market capitalization of $2.21 billion as of May 2020. The company operates 146 hotels and 11 theme parks. Playa Hotels & Resorts NV is a publicly traded company that operates in the tourism industry. The company specializes in all-inclusive resorts. The company was founded in 1998 and is headquartered in Amsterdam, Netherlands. The company has a market capitalization of $2.84 billion as of May 2020. The company operates 69 resorts in 16 countries. Peloton Interactive Inc is a publicly traded company that operates in the fitness industry. The company specializes in home fitness equipment and streaming fitness classes. The company was founded in 2012 and is headquartered in New York City. The company has a market capitalization of $9.48 billion as of May 2020.
– PT Panorama Sentrawisata Tbk ($IDX:PANR)
PANORAMA is one of the leading providers of integrated tourism solutions in Indonesia. The company offers a wide range of services, including hotel and restaurant management, tour and travel services, event management, and more. PANORAMA has a market cap of 398.4B as of 2022 and a Return on Equity of -2.2%. The company is headquartered in Jakarta, Indonesia.
– Playa Hotels & Resorts NV ($NASDAQ:PLYA)
Playa Hotels & Resorts NV is a hotel and resort company that owns and operates properties in Mexico, the Dominican Republic, and Jamaica. As of 2022, the company had a market cap of 956.46M and a return on equity of 11.41%. The company’s properties include all-inclusive resorts, family-friendly resorts, and adults-only resorts.
– Peloton Interactive Inc ($NASDAQ:PTON)
Peloton Interactive Inc is a company that operates in the fitness industry and is known for its Peloton line of exercise bikes. The company has a market cap of 3.2B as of 2022 and a Return on Equity of -409.16%. Peloton was founded in 2012 and is headquartered in New York, NY.
Summary
LINDBLAD EXPEDITIONS reported their earnings results for the fourth quarter of FY2022, with total revenue of USD -32.2 million, a 22.2% decline from the same period last year. However, net income saw an 80.0% increase year-over-year, to USD 118.0 million. Despite this positive news, the stock price moved down the same day, suggesting investors remain uncertain about the company’s overall performance. Thus, investors should exercise caution when considering investing in LINDBLAD EXPEDITIONS as the stock price may be volatile and future performance is uncertain.
Related Posts


Recent Posts


Investing Everyone Can Do.
Investing shouldn’t be exclusive to a select few. We believe everyone should have the opportunity to grow their wealth. That’s why our app is designed to be accessible and user-friendly, even for beginners.
