KROGER Reports Record-Breaking Earnings for FY2024 Q2
June 28, 2023

🌥️Earnings Overview
Kroger ($NYSE:KR) reported their financial results for the second quarter of FY2024, ending May 31 2023. The total revenue for the period was USD 45165.0 million, a 30.4% increase compared to the prior year’s quarter. The net income for the quarter was USD 962.0 million, a 31.6% growth over the same quarter of the previous year.
Stock Price
On Thursday, the stock of KROGER opened at $44.4 and closed at $45.9, marking a 2.7% drop from its prior closing price of 47.2. Despite the recent decline in its stock price, KROGER reported record-breaking earnings for the second quarter of fiscal year 2024. This impressive performance was mainly driven by KROGER’s ongoing digital transformation efforts and its growing market share in the grocery sector. This significant increase was attributed to cost reductions and efficiencies across the business.
The impressive quarterly results, coupled with the company’s commitment to delivering value to customers, has led to the stock reaching an all-time high on Thursday. Despite the recent decline in KROGER’s stock price, the company’s record-breaking earnings for FY2024 Q2 has signaled the strength of KROGER’s position in the market and have investors feeling confident about its future prospects. Live Quote…
About the Company
Income Snapshot
Below shows the total revenue, net income and net margin for Kroger. More…
| Total Revenues | Net Income | Net Margin |
| 148.82k | 2.55k | 1.8% |
Cash Flow Snapshot
Below shows the cash from operations, investing and financing for Kroger. More…
| Operations | Investing | Financing |
| 6.26k | -3.24k | -1.77k |
Balance Sheet Snapshot
Below shows the total assets, liabilities and book value per share for Kroger. More…
| Total Assets | Total Liabilities | Book Value Per Share |
| 50.19k | 39.31k | 13.99 |
Key Ratios Snapshot
Some of the financial key ratios for Kroger are shown below. More…
| 3Y Rev Growth | 3Y Operating Profit Growth | Operating Margin |
| 4.9% | 11.7% | 2.6% |
| FCF Margin | ROE | ROA |
| 1.9% | 24.0% | 4.8% |
Analysis
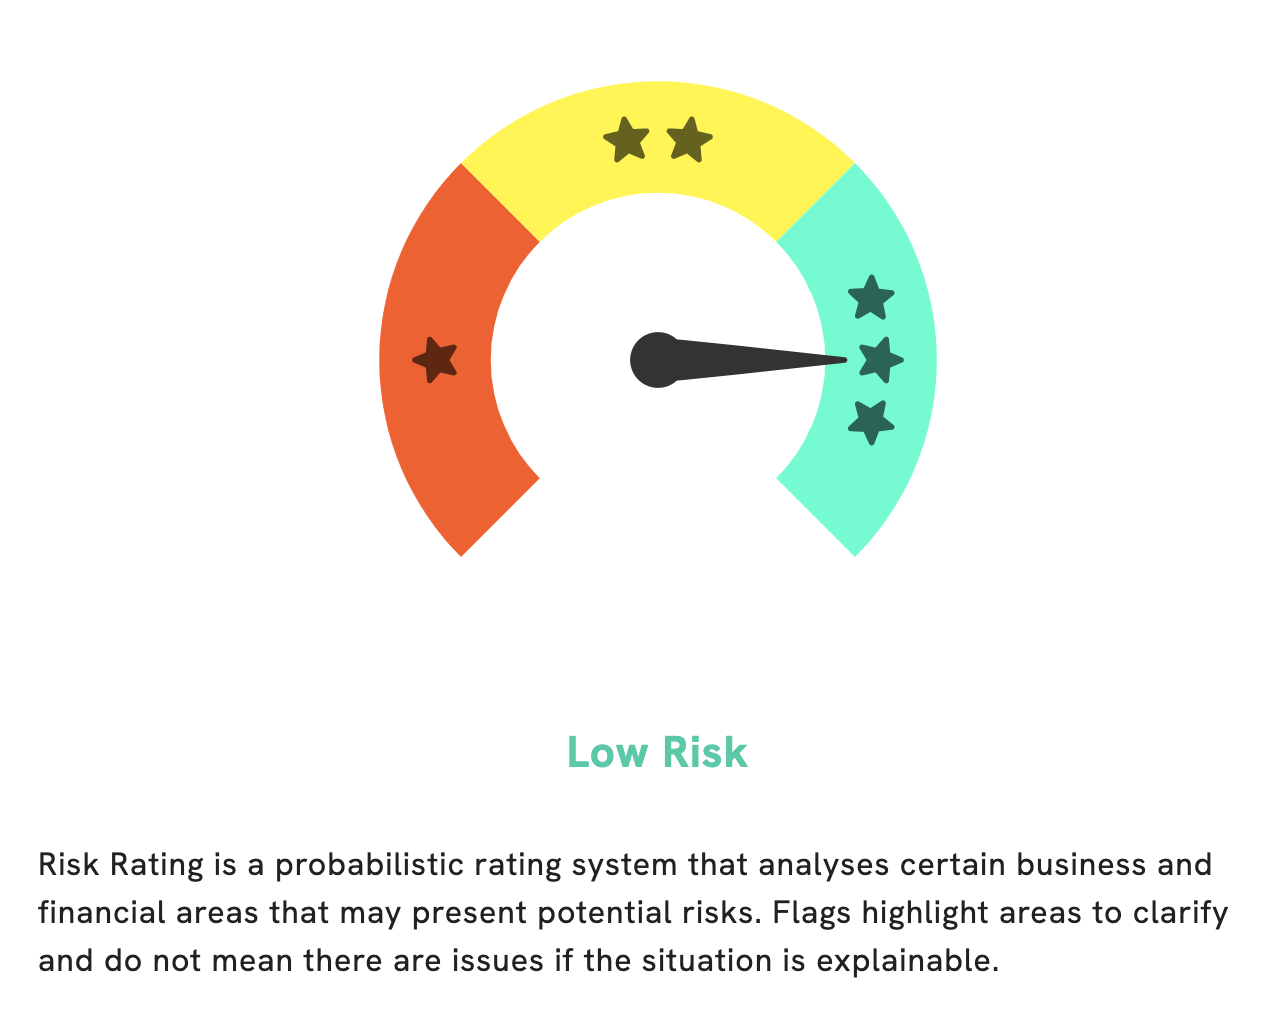
At GoodWhale, we have conducted an analysis of KROGER‘s fundamentals. After our thorough assessment, we have determined that KROGER is a low risk investment in terms of financial and business aspects. However, we have detected two risk warnings in the income sheet and balance sheet. In order to access more detailed information about our KROGER analysis, you must become a registered user of our site. We invite you to join us to learn more about KROGER’s fundamentals and to take advantage of our risk assessment services. More…
Peers
The Kroger Co is the largest supermarket chain in the United States. It operates 2,800 supermarkets and multi-department stores in 35 states and the District of Columbia under two dozen local banner names including Kroger, City Market, Dillons, Food 4 Less, Fred Meyer, Harris Teeter, Jay C, King Soopers, QFC, Ralphs and Smith’s. Albertsons Companies Inc is the 2nd largest supermarket chain in the United States with 2,200 stores across 34 states and the District of Columbia. Sprouts Farmers Market Inc is the 3rd largest U.S. supermarket chain with 340 stores across 22 states. Grocery Outlet Holding Corp is the 4th largest U.S. supermarket chain with nearly 300 stores across 23 states.
– Albertsons Companies Inc ($NYSE:ACI)
Albertsons Companies Inc is a grocery store chain in the United States. It is the second-largest grocery store chain in the country after Walmart. The company has a market cap of 14.26B as of 2022 and a Return on Equity of 45.75%. Albertsons was founded in 1939 in Boise, Idaho. The company operates stores under the Albertsons, Safeway, Vons, Pavilions, Randalls, Tom Thumb, and Carrs banners. The company also has a pharmacy chain, under the Albertsons Pharmacy banner.
– Sprouts Farmers Market Inc ($NASDAQ:SFM)
Sprouts Farmers Market Inc is a grocery store chain based in the United States. The company offers a variety of fresh and organic produce, meats, and other groceries. As of 2022, Sprouts Farmers Market Inc has a market cap of 3B and a Return on Equity of 21.14%. The company has been growing steadily in recent years, and its strong financial performance is expected to continue in the future.
– Grocery Outlet Holding Corp ($NASDAQ:GO)
Grocery Outlet Holding Corp is a publicly traded company that owns and operates a chain of discount grocery stores. The company was founded in 1946 and is headquartered in Emeryville, California. As of 2022, the company had a market cap of 3.22 billion and a return on equity of 6.43%. The company’s stores offer a wide variety of food and household products at discount prices.
Summary
Kroger reported strong financial results for the second quarter of their fiscal year 2024. This is an impressive performance for the largest grocery chain in the United States, and investors should take note. Kroger has clearly demonstrated that it can compete in a challenging market and generate strong returns for shareholders. Long term investors should consider adding shares of Kroger to their portfolio, as it is likely to achieve continued success in the future.
Related Posts


Recent Posts


Investing Everyone Can Do.
Investing shouldn’t be exclusive to a select few. We believe everyone should have the opportunity to grow their wealth. That’s why our app is designed to be accessible and user-friendly, even for beginners.
