KELLOGG COMPANY Reports Q2 FY2023 Earnings Results as of June 30, 2023
August 16, 2023

🌥️Earnings Overview
For the second quarter of FY2023, KELLOGG COMPANY ($NYSE:K) reported total revenues of USD 4041.0 million, representing a 4.6% year-on-year increase. Reported net income also surged 9.5% to USD 357.0 million compared to the same period of the preceding year, ending June 30 2023.
Stock Price
KELLOGG COMPANY reported their Q2 FY2023 earnings results on Thursday, June 30, 2023. The stock opened at $66.7 and closed at $66.2, representing a decrease of 0.6% compared to the prior closing price of 66.6. The growth in net profits was largely driven by increased sales, which were up 4%, as well as cost-cutting initiatives and increased efficiency in the production process.
In addition, KELLOGG COMPANY has seen strong performance from its new product line, which has helped boost overall revenue. Looking forward, KELLOGG COMPANY is confident that it will continue to benefit from the positive momentum in the market and its efforts to remain competitive in the space. The company is optimistic that it can continue to grow its profits and increase shareholder value over the long-term. Live Quote…
About the Company
Income Snapshot
Below shows the total revenue, net income and net margin for Kellogg Company. More…
| Total Revenues | Net Income | Net Margin |
| 15.87k | 867 | 5.5% |
Cash Flow Snapshot
Below shows the cash from operations, investing and financing for Kellogg Company. More…
| Operations | Investing | Financing |
| 1.49k | -474 | -997 |
Balance Sheet Snapshot
Below shows the total assets, liabilities and book value per share for Kellogg Company. More…
| Total Assets | Total Liabilities | Book Value Per Share |
| 18.1k | 13.88k | 11.58 |
Key Ratios Snapshot
Some of the financial key ratios for Kellogg Company are shown below. More…
| 3Y Rev Growth | 3Y Operating Profit Growth | Operating Margin |
| 5.6% | 1.3% | 8.6% |
| FCF Margin | ROE | ROA |
| 5.9% | 21.2% | 4.7% |
Analysis
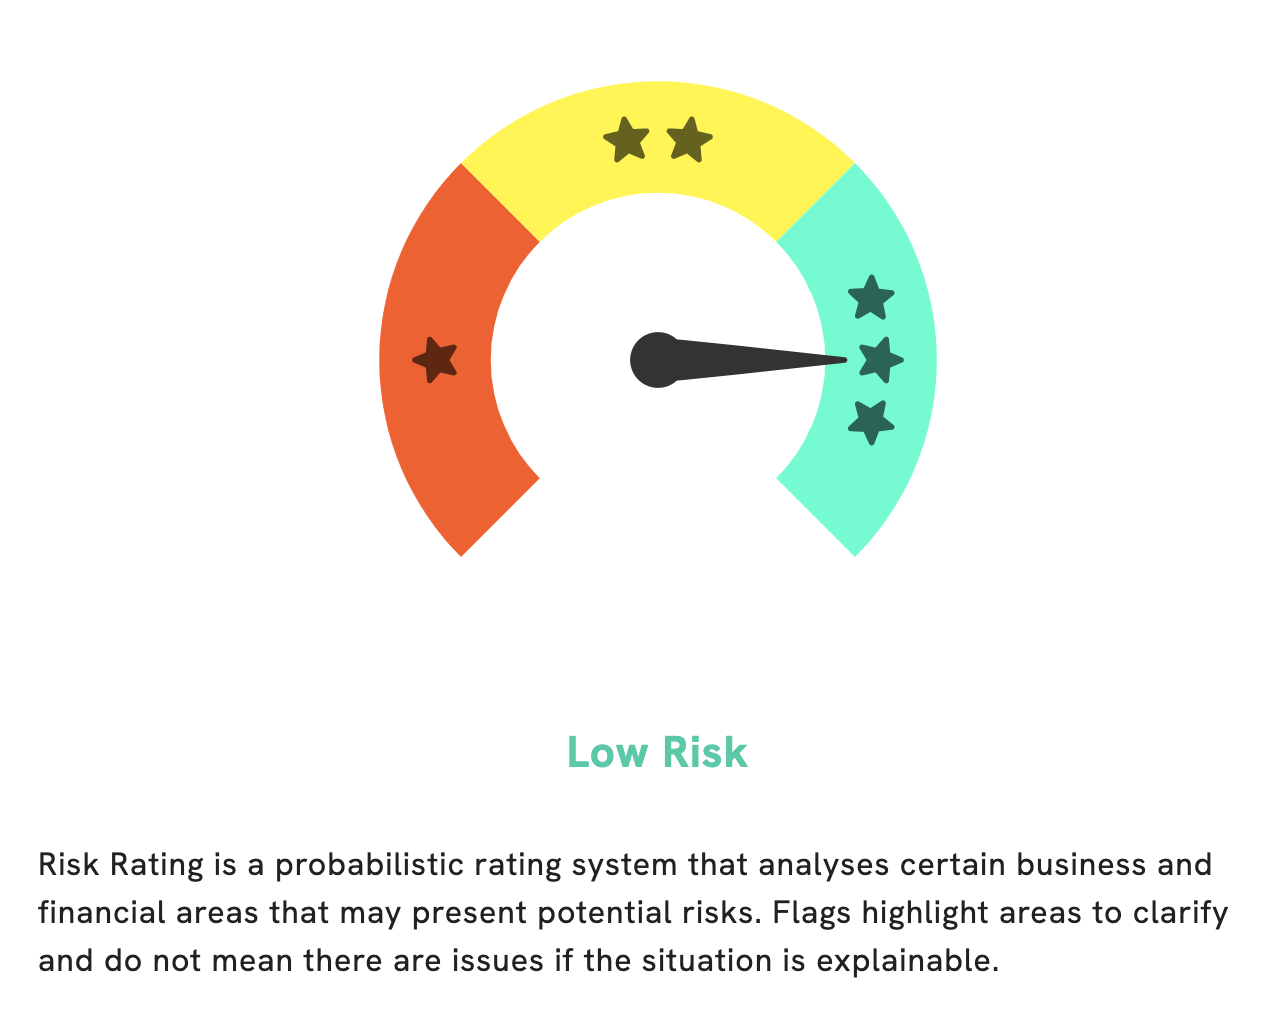
At GoodWhale, we conducted a comprehensive analysis of Kellogg Company‘s wellbeing. We collected data from various sources in order to create an overall picture of Kellogg Company’s financial and business standing. After extensive review, we determined that Kellogg Company is a low risk investment. While we did detect one warning signal in Kellogg Company’s cashflow statement, we believe that this does not pose a major risk. However, to ensure investors are adequately informed, we encourage you to register on our website to learn more about our findings and explore the full implications of this warning signal. Our team at GoodWhale is committed to providing companies and investors with detailed insights into the wellbeing of their investments. We strive to arm investors with the knowledge they need to make informed decisions and invest responsibly. More…
Peers
Kellogg Co is in competition with Nestle SA, McCormick & Co Inc, and Procter & Gamble Co. All four companies are large, international corporations that manufacture and sell food products. Kellogg Co’s primary product is cereal, but it also manufactures snacks and frozen foods. Nestle SA is a Swiss company that is the largest food company in the world. It manufactures a wide variety of food products, including baby food, bottled water, cereals, coffee, and confectioneries. McCormick & Co Inc is an American company that manufactures spices, herbs, and seasonings. Procter & Gamble Co is an American company that manufactures a wide variety of consumer goods, including food, beverages, cleaning products, and personal care products.
– Nestle SA ($OTCPK:NSRGY)
Nestle SA is a food and beverage company with a market capitalization of 288.43 billion as of 2022. The company has a return on equity of 14.82%. Nestle SA is a food and beverage company that manufactures and markets a variety of food and beverage products, including baby food, bottled water, cereals, coffee, dairy products, and pet food. The company has operations in over 190 countries and employs over 339,000 people.
– McCormick & Co Inc ($NYSE:MKC)
McCormick & Co Inc is a US-based company that manufactures, markets, and distributes spices, seasoning mixes, condiments, and other flavoring products. It has a market cap of 19.85B as of 2022 and a return on equity of 13.21%. The company operates through three segments: Consumer, Industrial, and Other.
– Procter & Gamble Co ($NYSE:PG)
Procter & Gamble Co is a consumer goods company with a market cap of $304.7B as of 2022. The company has a return on equity of 25.38%. Procter & Gamble Co manufactures and markets a variety of consumer goods, including beauty, grooming, health care, fabric care and home care products. The company operates in over 180 countries and has over 125,000 employees. Procter & Gamble Co is one of the largest consumer goods companies in the world.
Summary
Investors interested in KELLOGG COMPANY should be encouraged by the company’s recent financial results. In the second quarter of FY2023, total revenue increased by 4.6% year-on-year to USD 4041.0 million, with reported net income rising 9.5% to USD 357.0 million. This is a positive indication of KELLOGG’s financial health, and investors should consider the stock as a potential investment. Other factors such as market trends and the company’s overall strategy should be taken into consideration when making investment decisions.
Related Posts


Recent Posts


Investing Everyone Can Do.
Investing shouldn’t be exclusive to a select few. We believe everyone should have the opportunity to grow their wealth. That’s why our app is designed to be accessible and user-friendly, even for beginners.
