KELLANOVA Reports Third Quarter Fiscal Year 2023 Earnings Results
December 18, 2023

🌥️Earnings Overview
Kellanova ($NYSE:K) released their financial results for the three months ending September 30 2023 on November 8 2023. Total revenue for the third quarter of fiscal year 2023 amounted to USD 3939.0 million, a marginal decrease of 0.2% in comparison to the year-ago period. Net income for the quarter declined by 13.2%, settling at USD 269.0 million.
Price History
On Wednesday, KELLANOVA reported third quarter fiscal year 2023 earnings results. The company’s stock opened at $52.6 and closed at $52.0, representing a 2.1% increase from its previous closing price of $50.9. The company’s earnings report was better than expected, and investors reacted positively to the news.
The strong financial performance of KELLANOVA in the third quarter was driven by higher sales in their consumer electronics division as well as higher margins in their apparel division. Going forward, the company is confident that it will continue to generate strong financial results for the remainder of the fiscal year. Live Quote…
About the Company
Income Snapshot
Below shows the total revenue, net income and net margin for Kellanova. More…
| Total Revenues | Net Income | Net Margin |
| 15.87k | 826 | 5.2% |
Cash Flow Snapshot
Below shows the cash from operations, investing and financing for Kellanova. More…
| Operations | Investing | Financing |
| 1.87k | -608 | -536 |
Balance Sheet Snapshot
Below shows the total assets, liabilities and book value per share for Kellanova. More…
| Total Assets | Total Liabilities | Book Value Per Share |
| 18.7k | 14.42k | 11.79 |
Key Ratios Snapshot
Some of the financial key ratios for Kellanova are shown below. More…
| 3Y Rev Growth | 3Y Operating Profit Growth | Operating Margin |
| 5.5% | 0.6% | 8.8% |
| FCF Margin | ROE | ROA |
| 7.7% | 21.8% | 4.7% |
Analysis
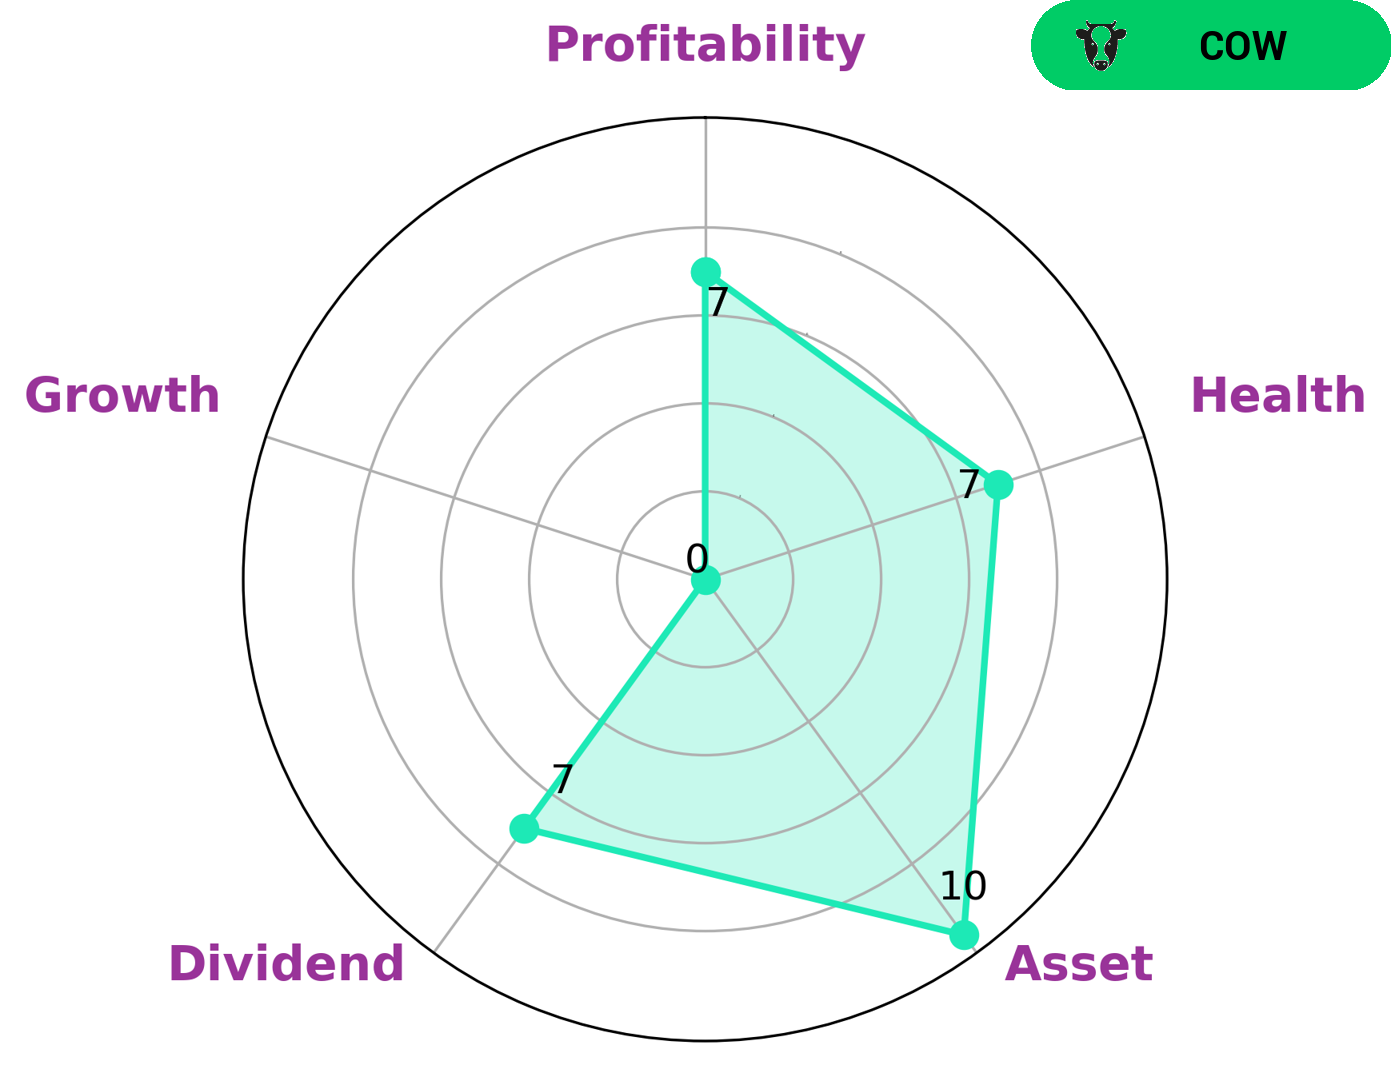
As a GoodWhale analyst, we took a close look at the fundamentals of KELLANOVA. According to our Star Chart, KELLANOVA is strong in asset, dividend, and profitability, and weak in growth. Based on this assessment, we have classified it as a ‘rhino’, meaning it has achieved moderate revenue or earnings growth. With such a company profile, we believe that value investors may be interested in KELLANOVA due to its strong asset and dividend profiles. We also see that KELLANOVA has a high health score of 8/10 with regard to its cashflows and debt, suggesting that it is capable to pay off debt and fund future operations. More…
Peers
Kellogg Co is in competition with Nestle SA, McCormick & Co Inc, and Procter & Gamble Co. All four companies are large, international corporations that manufacture and sell food products. Kellogg Co’s primary product is cereal, but it also manufactures snacks and frozen foods. Nestle SA is a Swiss company that is the largest food company in the world. It manufactures a wide variety of food products, including baby food, bottled water, cereals, coffee, and confectioneries. McCormick & Co Inc is an American company that manufactures spices, herbs, and seasonings. Procter & Gamble Co is an American company that manufactures a wide variety of consumer goods, including food, beverages, cleaning products, and personal care products.
– Nestle SA ($OTCPK:NSRGY)
Nestle SA is a food and beverage company with a market capitalization of 288.43 billion as of 2022. The company has a return on equity of 14.82%. Nestle SA is a food and beverage company that manufactures and markets a variety of food and beverage products, including baby food, bottled water, cereals, coffee, dairy products, and pet food. The company has operations in over 190 countries and employs over 339,000 people.
– McCormick & Co Inc ($NYSE:MKC)
McCormick & Co Inc is a US-based company that manufactures, markets, and distributes spices, seasoning mixes, condiments, and other flavoring products. It has a market cap of 19.85B as of 2022 and a return on equity of 13.21%. The company operates through three segments: Consumer, Industrial, and Other.
– Procter & Gamble Co ($NYSE:PG)
Procter & Gamble Co is a consumer goods company with a market cap of $304.7B as of 2022. The company has a return on equity of 25.38%. Procter & Gamble Co manufactures and markets a variety of consumer goods, including beauty, grooming, health care, fabric care and home care products. The company operates in over 180 countries and has over 125,000 employees. Procter & Gamble Co is one of the largest consumer goods companies in the world.
Summary
Investors may be concerned about Kellanova‘s third quarter fiscal year 2023 financial results. Total revenue decreased by 0.2% and net income decreased by 13.2% compared to the same quarter in the previous year. Despite this drop in performance, overall the company has shown signs of resilience, with a generally good track record of continuing profits. It is important for investors to weigh the potential risks and rewards of investing in the company before making any decisions.
Related Posts


Recent Posts


Investing Everyone Can Do.
Investing shouldn’t be exclusive to a select few. We believe everyone should have the opportunity to grow their wealth. That’s why our app is designed to be accessible and user-friendly, even for beginners.
