KARORA RESOURCES Reports 48.3% Increase in Net Income for Q1 FY2023
June 1, 2023

☀️Earnings Overview
For the first quarter of FY2023 ending on March 31 2023, KARORA RESOURCES ($BER:5RN1) reported total revenue of CAD 96.8 million and net income of CAD -2.9 million, which was a 48.3% increase from the same period last year when their net income was -3.7 million.
Analysis
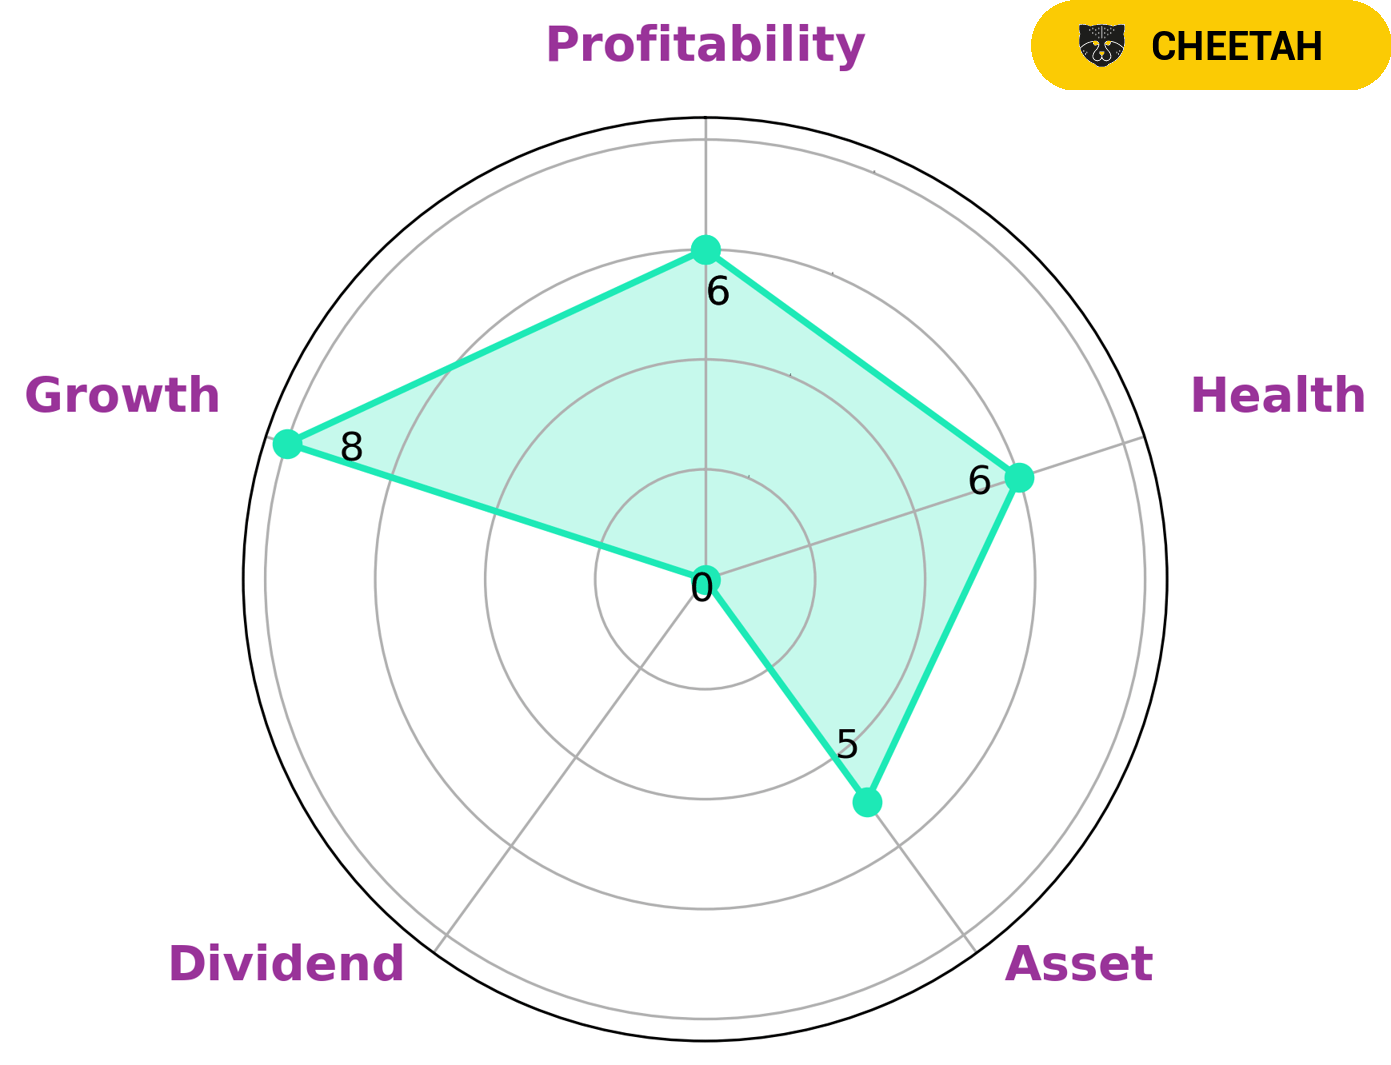
According to Star Chart, KARORA RESOURCES has an intermediate health score of 6/10 with regard to its cashflows and debt, indicating it is likely to pay off debt and fund future operations. Moreover, KARORA RESOURCES is classified as ‘cheetah’, which implies high revenue or earnings growth but is considered less stable due to lower profitability. Therefore, investors with a higher risk tolerance and an appetite for growth may be interested in investing in KARORA RESOURCES. Furthermore, KARORA RESOURCES is strong in growth, medium in asset, profitability and weak in dividend. As such, investors who are interested in capital gains may be interested in investing in KARORA RESOURCES. More…
About the Company
Income Snapshot
Below shows the total revenue, net income and net margin for Karora Resources. More…
| Total Revenues | Net Income | Net Margin |
| 348.58 | 10.67 | 5.6% |
Cash Flow Snapshot
Below shows the cash from operations, investing and financing for Karora Resources. More…
| Operations | Investing | Financing |
| 96.93 | -165.28 | 57.01 |
Balance Sheet Snapshot
Below shows the total assets, liabilities and book value per share for Karora Resources. More…
| Total Assets | Total Liabilities | Book Value Per Share |
| 551.54 | 205.17 | 1.98 |
Key Ratios Snapshot
Some of the financial key ratios for Karora Resources are shown below. More…
| 3Y Rev Growth | 3Y Operating Profit Growth | Operating Margin |
| 26.7% | 7.8% | 6.6% |
| FCF Margin | ROE | ROA |
| -19.9% | 4.1% | 2.6% |
Summary
KARORA RESOURCES has reported strong financial performance for the first quarter of FY2023, with total revenue of CAD 96.8 million and a net income of CAD -2.9 million. This represents a 48.3% increase from the prior quarter’s net income of -3.7 million. This positive momentum should be of interest to investors, as it indicates a potential trend of upward growth for the company in the coming year.
KARORA RESOURCES’ strong financials demonstrate the potential for improved returns and overall profitability for shareholders in the near future. Investors should analyze the current financial state of KARORA RESOURCES to determine if it is a suitable addition to their portfolio.
Related Posts


Recent Posts


Investing Everyone Can Do.
Investing shouldn’t be exclusive to a select few. We believe everyone should have the opportunity to grow their wealth. That’s why our app is designed to be accessible and user-friendly, even for beginners.
