HOME DEPOT Reports Strong Earnings for Q2 FY2024
October 21, 2023

☀️Earnings Overview
For the second quarter of FY2024, which ended on July 31 2023, HOME DEPOT ($NYSE:HD) reported a total revenue of USD 42.9 billion, 2.0% lower than the same quarter in the prior year. Net income also decreased by 9.9% to USD 4.7 billion.
Market Price
On Tuesday, HOME DEPOT reported strong earnings for the second quarter of FY2024, with its stock opening at $331.8 and closing at $332.1, up by 0.7% from its previous closing price of $330.0. This growth was driven by strong increases in both customer traffic and average ticket size. The increase in net earnings was primarily attributed to its strong growth in the United States as well as international markets. HOME DEPOT’s operating results exceeded analysts’ expectations and resulted in a positive outlook for the company’s future performance.
Overall, HOME DEPOT had a strong quarter and posted impressive numbers, which further cemented its position as an industry leader. With its enhanced focus on customer experience and innovative digital initiatives, the company is well-positioned to continue its growth momentum in the coming quarters. Live Quote…
About the Company
Income Snapshot
Below shows the total revenue, net income and net margin for Home Depot. More…
| Total Revenues | Net Income | Net Margin |
| 154.88k | 16.23k | 10.5% |
Cash Flow Snapshot
Below shows the cash from operations, investing and financing for Home Depot. More…
| Operations | Investing | Financing |
| 19.64k | -3.58k | -14.46k |
Balance Sheet Snapshot
Below shows the total assets, liabilities and book value per share for Home Depot. More…
| Total Assets | Total Liabilities | Book Value Per Share |
| 76.39k | 75.05k | 0.36 |
Key Ratios Snapshot
Some of the financial key ratios for Home Depot are shown below. More…
| 3Y Rev Growth | 3Y Operating Profit Growth | Operating Margin |
| 9.1% | 11.3% | 15.0% |
| FCF Margin | ROE | ROA |
| 10.5% | 3999.3% | 19.0% |
Analysis
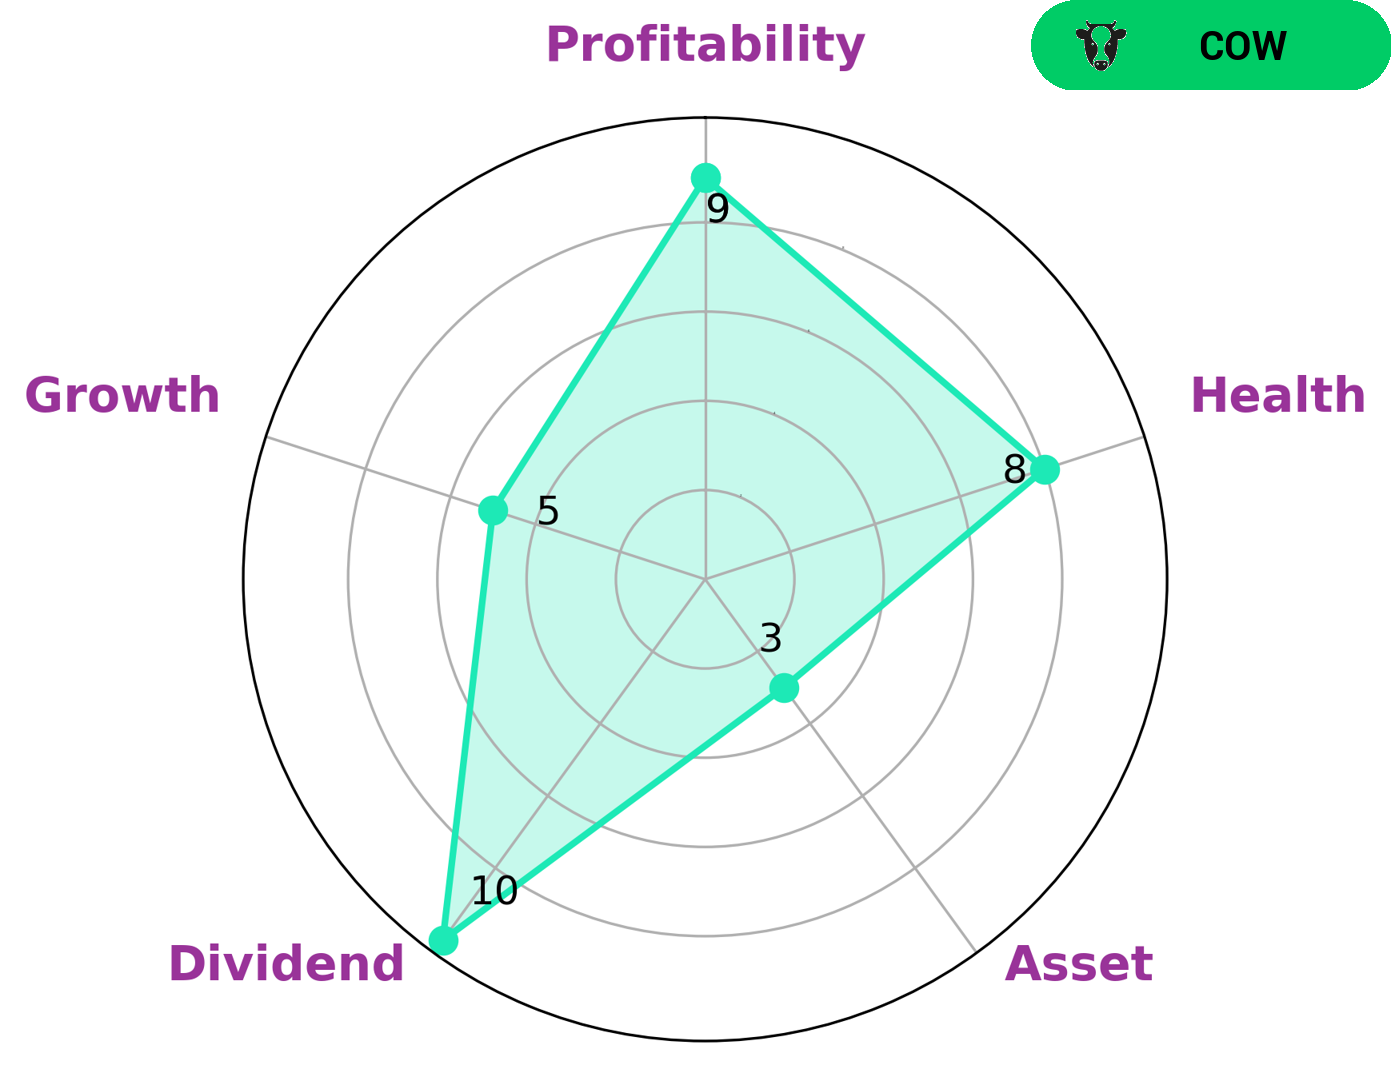
As GoodWhale, we conducted an analysis of HOME DEPOT‘s wellbeing. According to our Star Chart, HOME DEPOT has a high health score of 8/10 with regards to its cashflows and debt, indicating it is capable of riding out any crisis without the risk of bankruptcy. We classified HOME DEPOT as a ‘rhino’, a type of company that has achieved moderate revenue or earnings growth. This makes HOME DEPOT an attractive option for investors who are seeking a steady return on their investments. HOME DEPOT is strong in dividend and profitability, medium in growth, and weak in asset. These characteristics make it a suitable choice for investors who are looking for a reliable and consistent return, without taking on too much risk. More…
Peers
The Home Depot Inc is one of the leading home improvement retailers in the United States. The company operates more than 2,200 stores across the country. Lowe’s Companies Inc is another leading home improvement retailer in the United States. The company operates more than 1,700 stores across the country. Floor & Decor Holdings Inc is a leading specialty retailer of hard surface flooring in the United States. The company operates more than 100 stores across the country. Wayfair Inc is a leading online retailer of home furnishings and home décor products.
– Lowe’s Companies Inc ($NYSE:LOW)
Lowe’s Companies, Inc. is a home improvement company that operates stores in the United States, Canada, and Mexico. The company offers a wide variety of home improvement products, including appliances, tools, hardware, flooring, and more. Lowe’s is also involved in home improvement services, such as installation, repair, and remodeling. The company has a market cap of $114.17B and a return on equity of -99.39%.
– Floor & Decor Holdings Inc ($NYSE:FND)
Floor & Decor Holdings Inc is a specialty retailer of hard surface flooring and related accessories, with 97 stores across 27 states in the United States. The company offers a wide selection of ceramic tile, porcelain tile, natural stone, wood flooring, laminate, and vinyl flooring products. It also provides installation services for customers who purchase their products. Floor & Decor Holdings Inc has a market cap of 7.06B as of 2022, a Return on Equity of 14.88%.
– Wayfair Inc ($NYSE:W)
As of 2022, Wayfair Inc has a market cap of 3.37B and a Return on Equity of 29.2%. The company provides an online platform for home goods and furniture retailers. It operates through two segments, Direct and Marketplace. The Direct segment offers products through its own website. The Marketplace segment offers products through third-party websites.
Summary
HOME DEPOT‘s second quarter of FY2024 saw a slight decrease in total revenue and a larger decrease in net income, year over year. Despite this, there are still positive investing opportunities to be had. HOME DEPOT’s stock remains in demand and is trading at an all-time high, with market analysts expecting the stock to remain attractive to investors.
HOME DEPOT’s leadership is also taking steps to maximize value for shareholders, such as investing in its e-commerce platform and expanding its store network. Overall, HOME DEPOT remains an attractive long-term investment.
Related Posts


Recent Posts


Investing Everyone Can Do.
Investing shouldn’t be exclusive to a select few. We believe everyone should have the opportunity to grow their wealth. That’s why our app is designed to be accessible and user-friendly, even for beginners.
