HILLMAN SOLUTIONS Reports Fourth Quarter FY2022 Earnings Results on February 23, 2023.
March 26, 2023

Earnings Overview
On February 23 2023, HILLMAN SOLUTIONS ($NASDAQ:HLMN) reported their financial results for the fourth quarter of FY2022, with the quarter ending on December 31 2022. The company reported a total revenue decrease of 312.2% year over year and net income to have increased 1.8% over the same period. Total revenue was reported to be USD -13.9 million, and net income was USD 350.7 million.
Transcripts Simplified
Hillman Solutions reported net sales of $350.7 million for the fourth quarter of 2022, a 1.8% increase from the prior year quarter. Excluding the 53rd week of sales during 2022, net sales decreased by 2.8%. For the full-year, net sales increased 4.2% to $1.49 billion and adjusted earnings per diluted share was $0.43 per share compared to $0.51 per diluted share during 2021.
Adjusted gross profit margin increased over 260 basis points to 43.4% in the fourth quarter and increased over 60 basis points to 43% for the full-year. Adjusted EBITDA in the fourth quarter increased 16.5% to $45 million and adjusted EBITDA for the full-year increased 1.4% to $210.2 million.
About the Company
Income Snapshot
Below shows the total revenue, net income and net margin for Hillman Solutions. More…
| Total Revenues | Net Income | Net Margin |
| 1.49k | -16.44 | -1.1% |
Cash Flow Snapshot
Below shows the cash from operations, investing and financing for Hillman Solutions. More…
| Operations | Investing | Financing |
| 119.01 | -72.82 | -28.72 |
Balance Sheet Snapshot
Below shows the total assets, liabilities and book value per share for Hillman Solutions. More…
| Total Assets | Total Liabilities | Book Value Per Share |
| 2.47k | 1.31k | 5.95 |
Key Ratios Snapshot
Some of the financial key ratios for Hillman Solutions are shown below. More…
| 3Y Rev Growth | 3Y Operating Profit Growth | Operating Margin |
| 7.0% | 73.1% | 2.7% |
| FCF Margin | ROE | ROA |
| 3.3% | 2.1% | 1.0% |
Market Price
On Thursday, February 23, 2023, HILLMAN SOLUTIONS reported its earnings results of the fourth quarter of FY2022. The stock opened at an unchanged price of $8.8 and closed at the same price, representing a 0.4% decrease from its prior closing price of 8.9. Investors and analysts watched closely to see how the company would perform in light of the current global economic situation. Despite the uncertain times, HILLMAN SOLUTIONS was able to report better-than-expected results and posted strong growth in its quarterly revenues compared to the same period last year.
The company also reported a significant increase in its orders for the quarter, as well as a healthy cash flow position. These positive developments further strengthened investor confidence in HILLMAN SOLUTIONS’ ability to deliver sustainable returns. Overall, HILLMAN SOLUTIONS shareholders had reason to be pleased with the fourth quarter earnings results, as the company continues to show strong performance despite a challenging economic environment. Live Quote…
Analysis
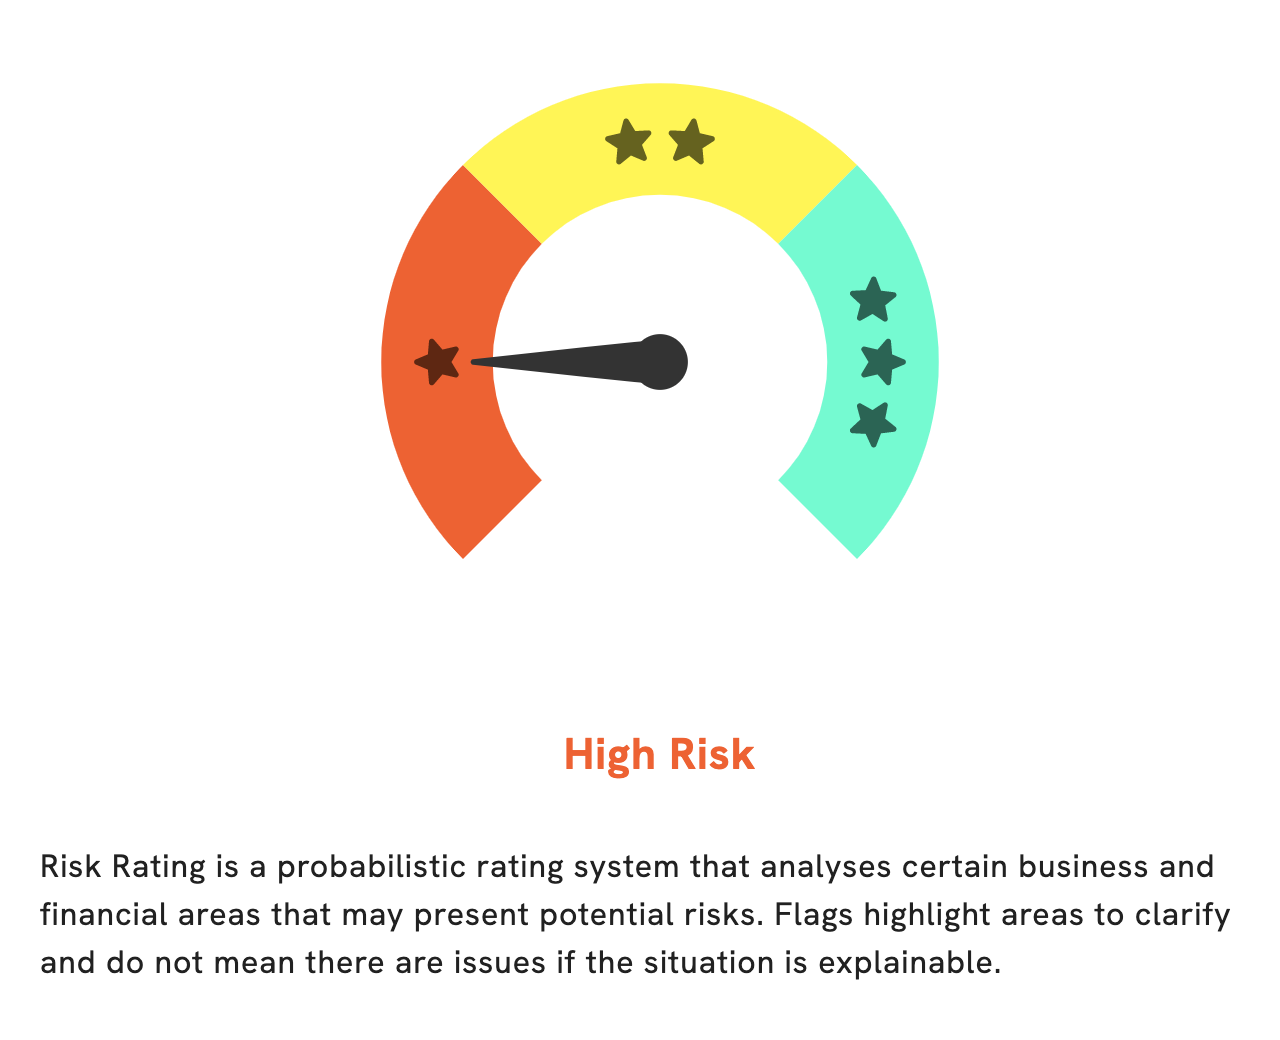
At GoodWhale, we recently conducted an analysis of HILLMAN SOLUTIONS‘s fundamentals. Based on our Risk Rating, HILLMAN SOLUTIONS is a high risk investment in terms of financial and business aspects. We have detected two risk warnings in their balance sheet and cashflow statement, so if you are considering investing in HILLMAN SOLUTIONS, we recommend you register with us and take a closer look at these issues. Our analysis will give you valuable insight into the financial health of the company and help you make an informed decision. More…
Peers
Its competitors are Q.E.P. Co Inc, Shinvest Holding Ltd, and StrongPoint ASA.
– Q.E.P. Co Inc ($OTCPK:QEPC)
Q.E.P. Co., Inc. engages in the manufacture and sale of flooring and flooring-related products. The company operates through three segments: Wood, Laminate, and Tools. It offers engineered hardwood, bamboo, cork, and laminate flooring products; ceramic and porcelain tiles; adhesives, grouts, underlayments, tools, and trims for flooring installation and finishing; and products for concrete surface preparation, including concrete saws, grinders, polishers, scarifiers, shot blasters, and floor scrapers. The company sells its products through distributors to specialty retail stores, home centers, hardware stores, and other retailers. Q.E.P. Co., Inc. was founded in 1979 and is based in Boca Raton, Florida.
– Shinvest Holding Ltd ($LTS:0JEZ)
StrongPoint ASA is a technology company that provides retail and logistics solutions. The company has a market cap of 846.68M as of 2022 and a return on equity of 4.23%. StrongPoint ASA’s solutions are used by retailers and logistics providers to increase efficiency, optimize operations and improve the customer experience.
Summary
HILLMAN SOLUTIONS‘ FY2022 fourth quarter results were a mixed bag for investors. Total revenue decreased substantially from the same period the year before, at -13.9 million USD.
However, the company was able to report a 1.8% increase in net income for the period, to 350.7 million USD. This could indicate that the company is continuing to make efficient use of its investments, despite the decrease in revenue. Investors should keep an eye on HILLMAN SOLUTIONS’ results in upcoming quarters to assess whether this trend continues.
Related Posts


Recent Posts


