HAYWARD HOLDINGS Reports Q2 FY2023 Earnings Results for Period Ending June 30, 2023
October 21, 2023

🌥️Earnings Overview
On August 2, 2023 HAYWARD HOLDINGS ($NYSE:HAYW) released their fiscal year 2023 second quarter earnings results for the period ending June 30, 2023. Total revenue experienced a 29.0% decrease compared to the same period last year, coming in at USD 283.5 million. Net income also decreased significantly by 55.6%, totalling USD 29.4 million.
Stock Price
The company opened its stock at $13.9 and closed at $13.9, representing a 3.3% increase from the prior closing price of $13.4. This was an overall positive report for the company, with the stock performing steadily throughout the day. Our strategies have paid off, resulting in greater revenues and profitability for HAYWARD HOLDINGS. We will continue to focus our efforts on making smart investments and reinforcing our financial strength.”
Overall, HAYWARD HOLDINGS’ stock performance and Q2 FY2023 earnings report shows positive signs for the future of the company. With its strong focus on innovation and smart investments, HAYWARD HOLDINGS is well positioned to continue its success in the future. Live Quote…
About the Company
Income Snapshot
Below shows the total revenue, net income and net margin for Hayward Holdings. More…
| Total Revenues | Net Income | Net Margin |
| 997.91 | 76.92 | 8.0% |
Cash Flow Snapshot
Below shows the cash from operations, investing and financing for Hayward Holdings. More…
| Operations | Investing | Financing |
| 218.78 | -31.08 | -91.02 |
Balance Sheet Snapshot
Below shows the total assets, liabilities and book value per share for Hayward Holdings. More…
| Total Assets | Total Liabilities | Book Value Per Share |
| 2.88k | 1.61k | 5.96 |
Key Ratios Snapshot
Some of the financial key ratios for Hayward Holdings are shown below. More…
| 3Y Rev Growth | 3Y Operating Profit Growth | Operating Margin |
| 21.5% | 52.8% | 17.1% |
| FCF Margin | ROE | ROA |
| 19.0% | 8.5% | 3.7% |
Analysis
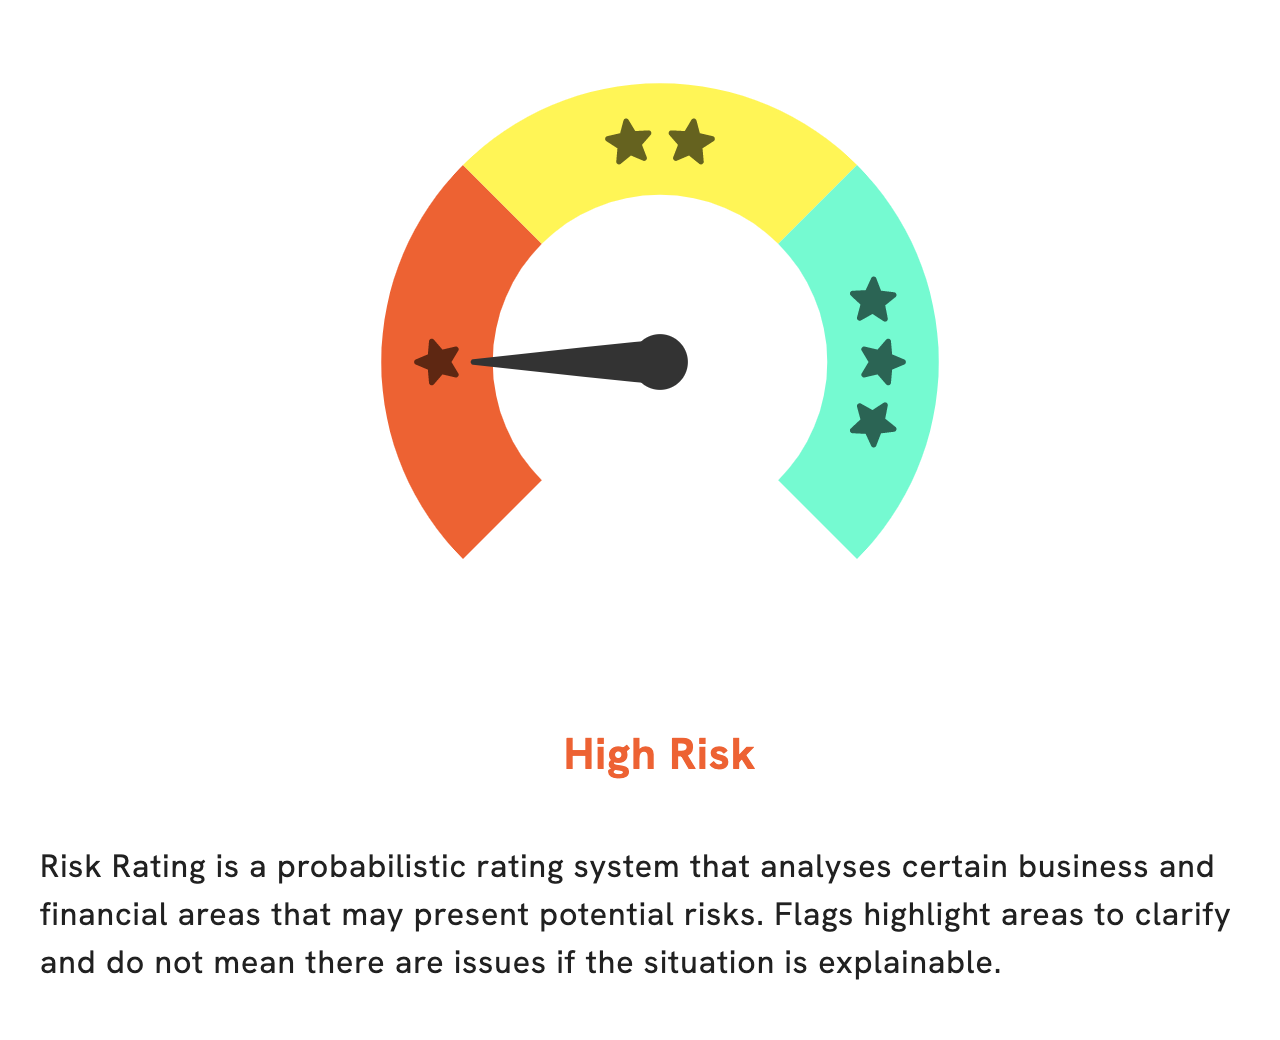
At GoodWhale, we conducted a wellbeing analysis of HAYWARD HOLDINGS. After extensive research, we have concluded that they are a high risk investment in terms of financial and business aspects. We have identified two risk warnings in their balance sheet and cashflow statement, and to view them, you must become a registered user of our platform. Our analysis has also shown that HAYWARD HOLDINGS has a high level of debt relative to their assets. We believe these factors could be an indication of potential problems with their business practices and overall financial health. As such, it is important for investors to be aware of these risks before investing in HAYWARD HOLDINGS. More…
Peers
The company operates in the United States, Canada, Europe, Asia, and South America. Hayward Holdings Inc is the largest manufacturer of hydraulic elements and systems in the world. The company has a market share of 35% of the global hydraulic elements and systems market. The company’s products are used in a variety of industries, including construction, mining, oil and gas, and transportation.
– Hydraulic Elements and Systems AD ($LTS:0NZ4)
IAD is a leading manufacturer of hydraulic components and systems. Its products are used in a wide range of industries, including construction, mining, agriculture, offshore, and industrial. IAD has a strong commitment to quality and innovation, and its products are backed by a team of experts who are available to provide support and advice. IAD’s products are available through a network of distributors and dealers worldwide.
– JE Cleantech Holdings Ltd ($NASDAQ:JCSE)
JE Cleantech Holdings Ltd is a clean technology company that provides solutions for the treatment of wastewater and solid waste. The company has a market cap of 12.09M as of 2022 and a return on equity of -2.6%. JE Cleantech Holdings Ltd is headquartered in Hong Kong.
– Advanced Energy Industries Inc ($NASDAQ:AEIS)
Advanced Energy Industries, Inc. operates as a designer and manufacturer of power conversion products that transform power into various usable forms. The company offers its products for original equipment manufacturers in the semiconductor, industrial, and solar power markets. Advanced Energy Industries, Inc. was founded in 1981 and is headquartered in Fort Collins, Colorado.
Summary
HAYWARD HOLDINGS reported their second quarter fiscal year 2023 earnings results on August 2, 2023, revealing a notable decline in both revenue and net income compared to the same period last year. Total revenue was USD 283.5 million, a decrease of 29.0%. Net income decreased to USD 29.4 million, representing a 55.6% dip. Despite the poor financial performance, the stock price moved up the same day.
Investors should take caution when considering investing in HAYWARD HOLDINGS due to the uncertain economic conditions and the company’s declining financial performance. Long-term investors may seek to understand the underlying factors leading to the decline in order to make more informed decisions about investing in the company.
Related Posts


Recent Posts


Investing Everyone Can Do.
Investing shouldn’t be exclusive to a select few. We believe everyone should have the opportunity to grow their wealth. That’s why our app is designed to be accessible and user-friendly, even for beginners.
