Globant S.a Intrinsic Value Calculator – GLOBANT S.A Reports Third Quarter Earnings Results for Fiscal Year 2023
November 24, 2023

🌥️Earnings Overview
GLOBANT S.A ($NYSE:GLOB) reported their fiscal year 2023 third quarter earnings on September 30 2023, exhibiting a total revenue of USD 545.3 million; an increase of 18.8% from the same period in the year prior. Net income for the quarter was reported at USD 43.8 million, a growth of 21.4% compared to the same quarter one year ago.
Stock Price
The stock opened at $184.6 and closed at $183.1, resulting in a 1.5% decrease from its previous closing price of $185.9. The decline in the company’s stock price can be attributed to weak market sentiments and the increasing uncertainty surrounding the global economy. The company attributed this increase to its cost-cutting initiatives and focus on innovation.
Overall, GLOBANT S.A reported solid earnings results that exceeded market expectations. Going forward, the company is confident that it will continue to grow with its strong focus on innovation and cost-efficiency measures. Live Quote…
About the Company
Income Snapshot
Below shows the total revenue, net income and net margin for Globant S.a. More…
| Total Revenues | Net Income | Net Margin |
| 2.01k | 155.94 | 9.1% |
Cash Flow Snapshot
Below shows the cash from operations, investing and financing for Globant S.a. More…
| Operations | Investing | Financing |
| 197.52 | -269.3 | -65.68 |
Balance Sheet Snapshot
Below shows the total assets, liabilities and book value per share for Globant S.a. More…
| Total Assets | Total Liabilities | Book Value Per Share |
| 2.39k | 642.54 | 39.95 |
Key Ratios Snapshot
Some of the financial key ratios for Globant S.a are shown below. More…
| 3Y Rev Growth | 3Y Operating Profit Growth | Operating Margin |
| 37.8% | 39.3% | 10.8% |
| FCF Margin | ROE | ROA |
| 5.1% | 8.1% | 5.7% |
Analysis – Globant S.a Intrinsic Value Calculator
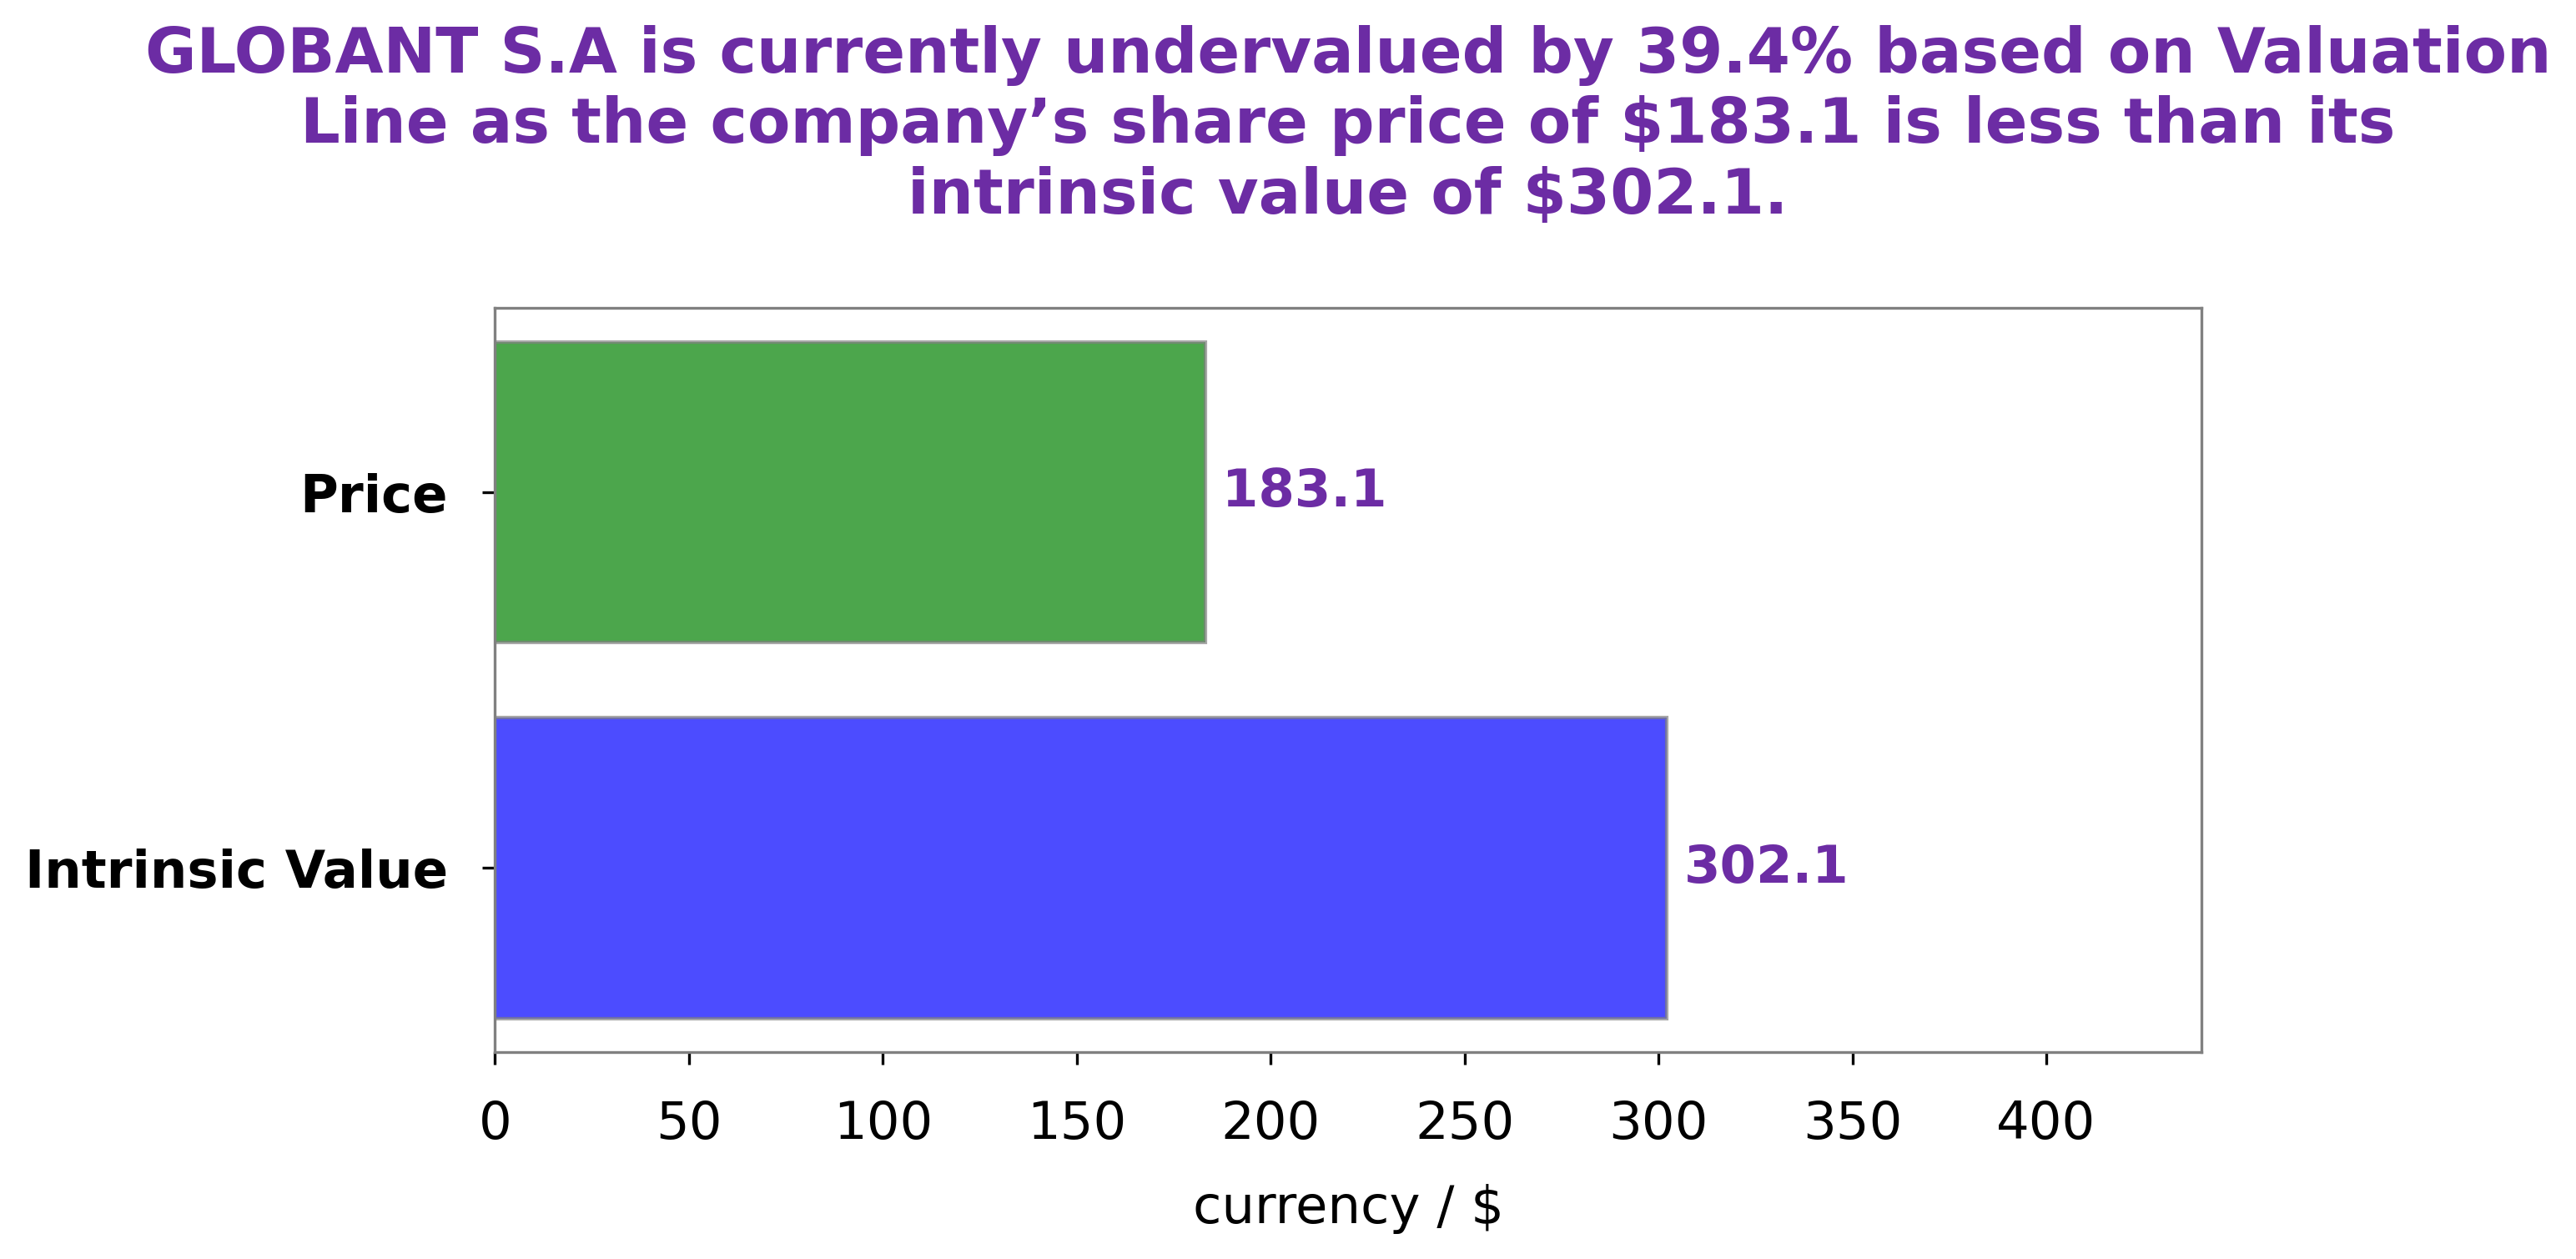
At GoodWhale, we recently conducted an analysis of GLOBANT S.A‘s wellbeing. By employing our proprietary Valuation Line, we were able to identify the intrinsic value of GLOBANT S.A share to be around $302.1. However, currently GLOBANT S.A stock is traded at $183.1, meaning it is undervalued by 39.4%. This presents a unique opportunity for investors looking to capitalize on such a discrepancy. We recommend investors to seize it, and add GLOBANT S.A to their portfolio. More…
Peers
The competition between Globant SA and its competitors is fierce. Each company is striving to be the best in the industry, and they are all fighting for market share. Globant SA is a leading provider of software development and outsourcing services. AudioEye Inc is a provider of web accessibility solutions. Gofore PLC is a provider of digital transformation services. Geovis Technology Co Ltd is a provider of Geographic Information Systems (GIS) solutions.
– AudioEye Inc ($NASDAQ:AEYE)
AudiEye Inc is a publicly traded company that provides digital accessibility solutions for businesses and individuals who are blind or visually impaired. The company has a market cap of 60.79M as of 2022 and a Return on Equity of -113.07%. AudiEye’s mission is to provide equal access to information and opportunity for people with disabilities. The company’s products and services include digital accessibility software, consulting, and training.
– Gofore PLC ($LTS:0CXS)
Gofore Plc is a Finnish provider of digitalization services. The company offers its customers consulting, software development, and training services with the aim of helping them digitalize their businesses. Gofore’s shares are listed on the Nasdaq Helsinki stock exchange.
Gofore’s market cap as of 2022 is 338.78M. The company has a Return on Equity of 14.21%. Gofore’s main competitors include Accenture, Deloitte, and IBM.
– Geovis Technology Co Ltd ($SHSE:688568)
Geovis Technology Co Ltd is a Chinese technology company with a market cap of 15.7 billion as of 2022. The company’s return on equity is 7.63%. Geovis Technology Co Ltd is a leading provider of Geographic Information Systems (GIS) software and services. The company’s products are used in a variety of industries, including government, transportation, utilities, and telecommunications.
Summary
GLOBANT S.A has reported positive financial marks for the third quarter of their fiscal year 2023. Total revenue increased 18.8% year over year to USD 545.3 million, while net income also saw a 21.4% jump to USD 43.8 million. This marks a solid period for the company which could indicate a strong future outlook. Investors should closely monitor GLOBANT S.A to assess its potential for growth in the coming quarters and make investment decisions based on market conditions.
Related Posts


Recent Posts


Investing Everyone Can Do.
Investing shouldn’t be exclusive to a select few. We believe everyone should have the opportunity to grow their wealth. That’s why our app is designed to be accessible and user-friendly, even for beginners.
