General Mills Intrinsic Value Calculator – GENERAL MILLS Reports Q4 FY2023 Earnings Results on June 28
June 30, 2023

🌥️Earnings Overview
For its fourth quarter of fiscal year 2023, which ended on May 31st 2023, GENERAL MILLS ($NYSE:GIS) reported total revenue of USD 5030.0 million, a 2.8% increase over the same quarter the previous year. Meanwhile, net income for the quarter fell 25.3%, to USD 614.9 million, compared to the same period in the previous year. The results were announced on June 28th.
Stock Price
On Wednesday, June 28, GENERAL MILLS reported its earnings results for the fourth quarter of fiscal year 2023. The stock opened at $78.9 and closed at $76.7, representing a 5.2% drop from its previous closing price of $80.9. Analysts attribute the drop to investors’ concerns over the company’s slowing growth rate due to strong competition from other food and beverage companies. This disappointed investors, resulting in the sharp drop in its share price on Wednesday. Despite the lackluster earnings results, GENERAL MILLS remains relatively financially healthy. Furthermore, it holds a competitive edge over other food and beverage companies in terms of its strong brand recognition and well-known product lineup. Overall, GENERAL MILLS’ Q4 FY2023 earnings results were disappointing, resulting in a drop in its share price on Wednesday.
However, it is still well-positioned to recover from this setback as it maintains a strong balance sheet and competitive advantage over other companies in the industry. Live Quote…
About the Company
Income Snapshot
Below shows the total revenue, net income and net margin for General Mills. More…
| Total Revenues | Net Income | Net Margin |
| 20.09k | 2.59k | 11.4% |
Cash Flow Snapshot
Below shows the cash from operations, investing and financing for General Mills. More…
| Operations | Investing | Financing |
| 2.78k | -346.4 | -2.4k |
Balance Sheet Snapshot
Below shows the total assets, liabilities and book value per share for General Mills. More…
| Total Assets | Total Liabilities | Book Value Per Share |
| 31.45k | 20.75k | 17.81 |
Key Ratios Snapshot
Some of the financial key ratios for General Mills are shown below. More…
| 3Y Rev Growth | 3Y Operating Profit Growth | Operating Margin |
| 4.5% | 0.7% | 17.6% |
| FCF Margin | ROE | ROA |
| 10.4% | 21.4% | 7.0% |
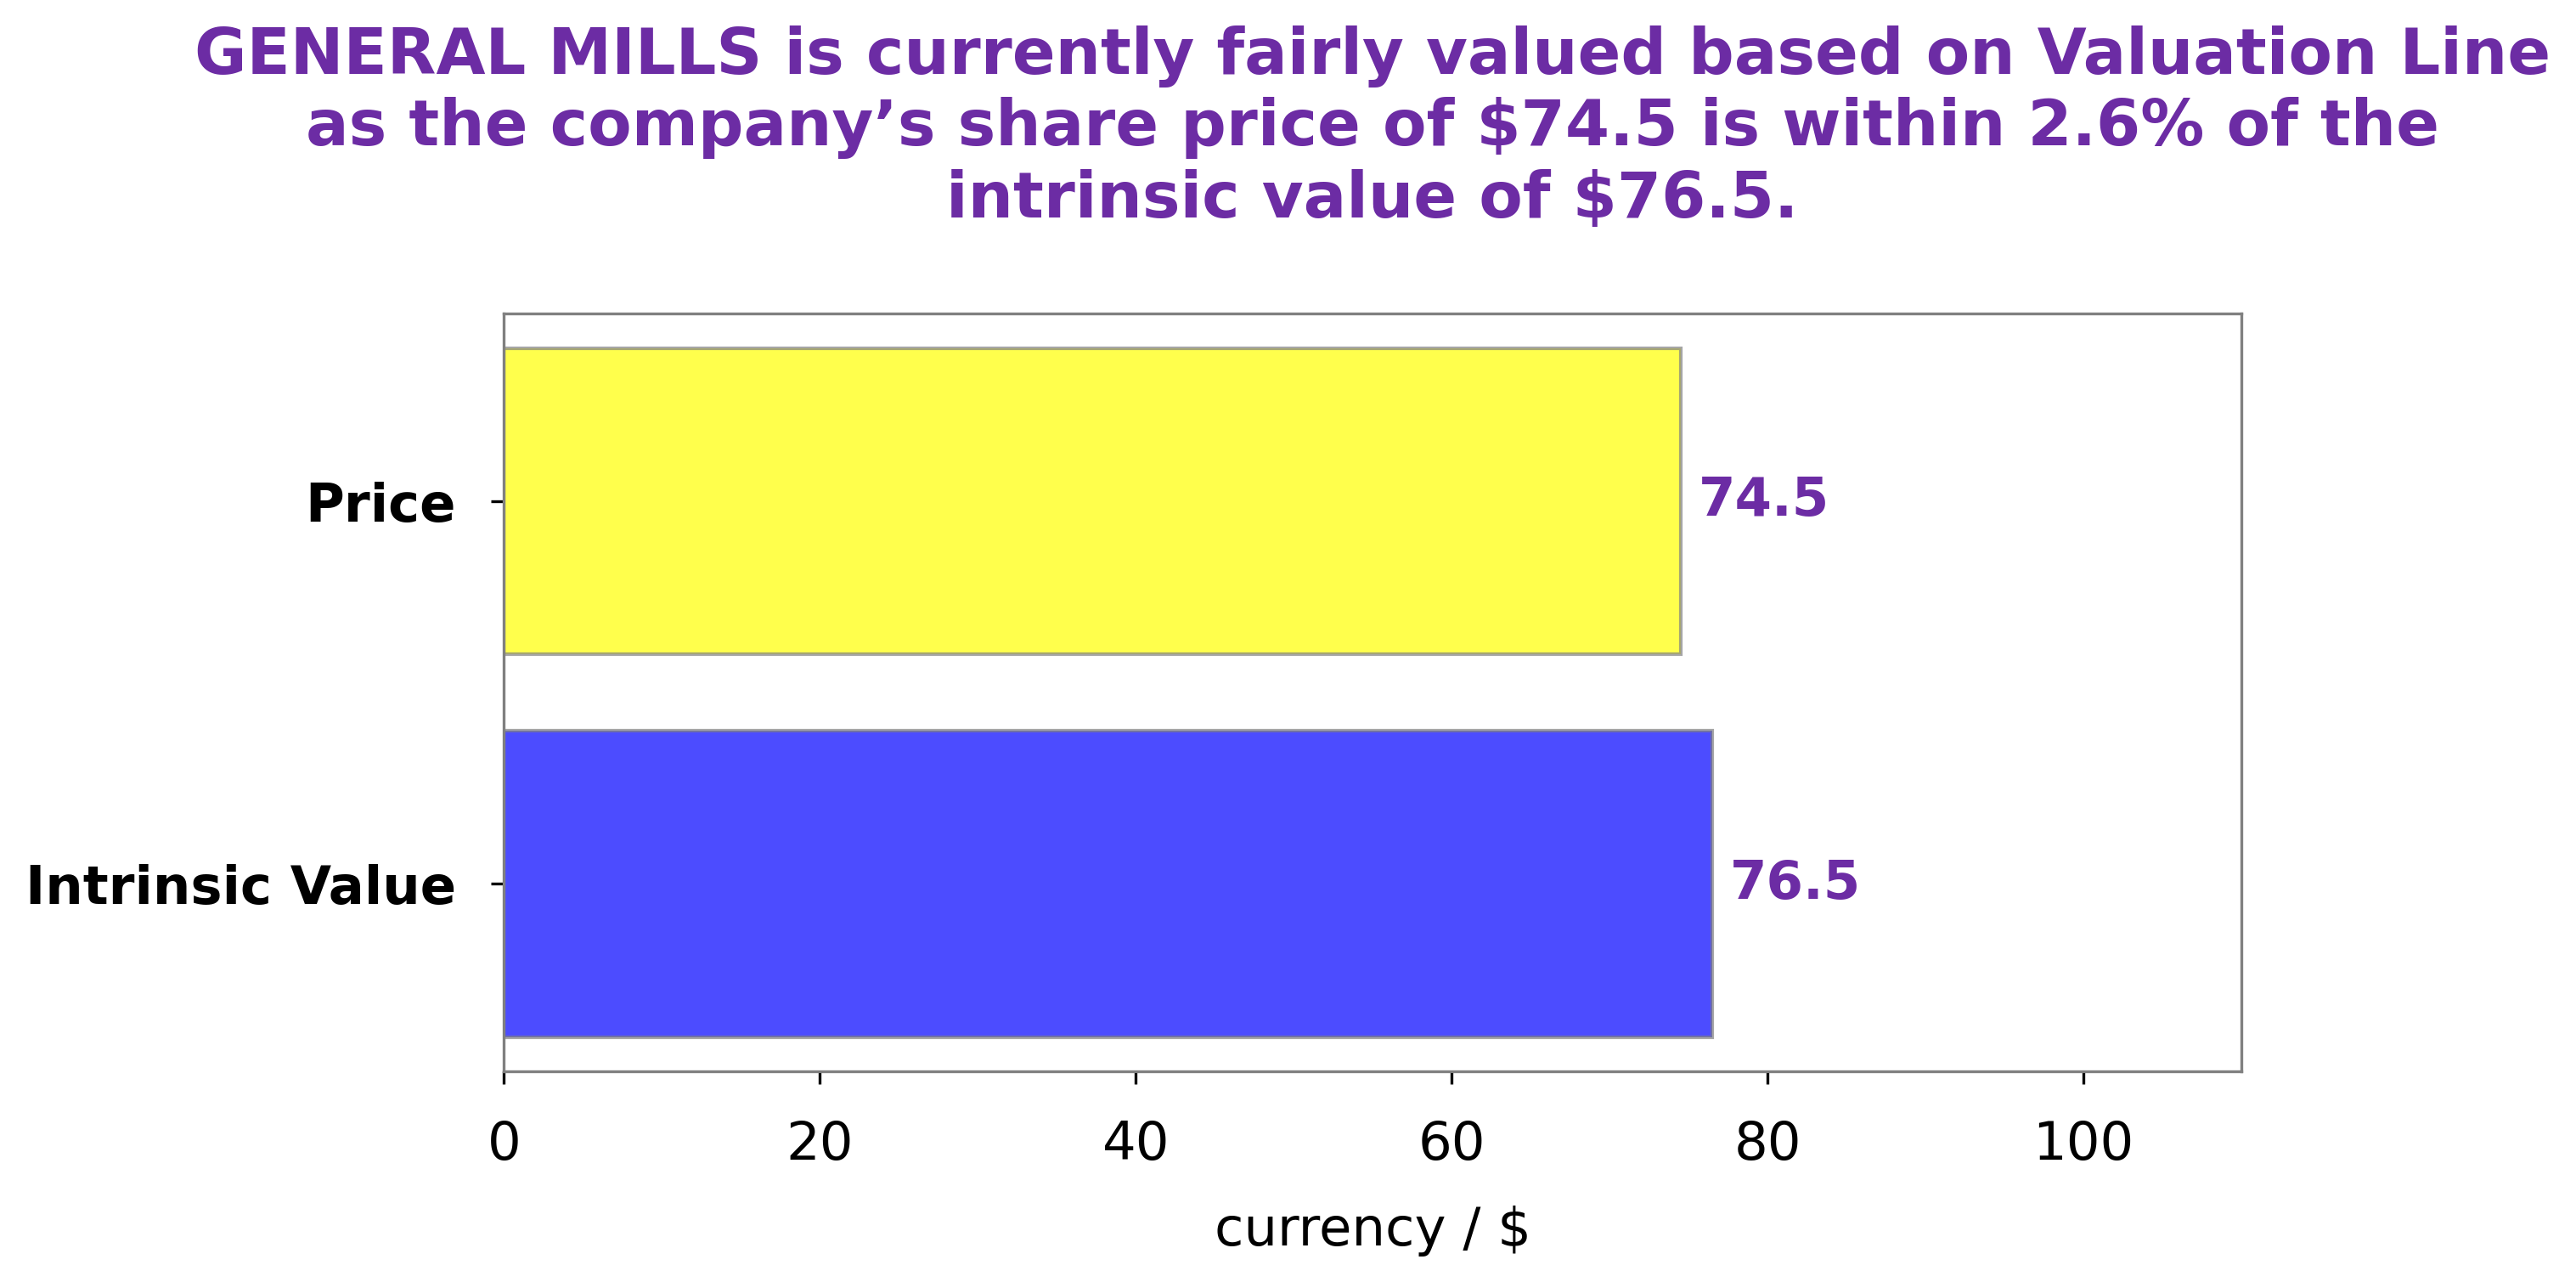
Analysis – General Mills Intrinsic Value Calculator
At GoodWhale, we conducted an analysis of General Mills‘ wellbeing in order to calculate the fair value of their stock. Through our proprietary Valuation Line, we determined that the fair value of General Mills shares is around $74.9. Currently, General Mills stock is traded at $76.7, slightly overvalued by 2.4%. Despite this, General Mills remains a strong investment for the long term. More…
Peers
JM Smucker Co, Newberry Specialty Bakers Inc, and J&J Snack Foods Corp are all companies that compete with General Mills Inc.
– JM Smucker Co ($NYSE:SJM)
The J.M. Smucker Company has a market capitalization of $14.97 billion as of 2022 and a return on equity of 7.19%. The company manufactures and markets food and beverage products, including coffee, peanut butter, shortening and oils, frozen sandwiches, fruit spreads, syrups, and toppings. It also produces pet food, pet snacks, and pet food ingredients. The company was founded in 1897 and is headquartered in Orrville, Ohio.
– Newberry Specialty Bakers Inc ($OTCPK:NBRY)
J&J Snack Foods Corp is a leading manufacturer and distributor of snack foods and beverages. The company’s products include pretzels, chips, popcorn, frozen desserts, and more. J&J Snack Foods Corp has a strong presence in the United States and internationally. The company’s products are sold in over 100 countries. J&J Snack Foods Corp is a publicly traded company on the NASDAQ stock exchange. The company’s stock ticker symbol is JJSF. J&J Snack Foods Corp was founded in 1971 and is headquartered in Pennsauken, New Jersey.
Summary
General Mills reported mixed financial results for the fourth quarter of its fiscal year 2023. Revenue increased by 2.8% year-over-year to $5030.0 million, however net income decreased by 25.3% over the same period. This resulted in the stock price falling on the same day.
For investors, this indicates that General Mills may be facing challenges in the short term, and may be a less attractive investment opportunity than other available options. While its revenue growth is promising, further analysis of its financial performance may be necessary to determine if General Mills is a viable investment option.
Related Posts


Recent Posts


Investing Everyone Can Do.
Investing shouldn’t be exclusive to a select few. We believe everyone should have the opportunity to grow their wealth. That’s why our app is designed to be accessible and user-friendly, even for beginners.
