Euronav Nv Stock Fair Value – EURONAV NV Reports Earnings Results for First Quarter of FY2023
May 27, 2023

Earnings Overview
On May 11 2023, EURONAV NV ($NYSE:EURN) announced their financial results for the first quarter of the fiscal year 2023, ending on March 31 2023. Revenue had climbed 197.2% year-over-year to reach USD 340.0 million. The company reported a net income of USD 175.0 million, a dramatic increase compared to the net loss of -43.4 million in the same period last year.
Share Price
The strong results were driven by growth in revenues and operating profitability. The increased revenue was mainly due to higher freight rates coupled with an increase in vessel demand from customers.
In addition, EURONAV NV continued to make investments in new vessels and other operational upgrades, which helped to improve operational efficiencies and streamline processes over the quarter. This allowed the company to take advantage of the higher demand environment and increase its market share. Going forward, the company is expected to continue its growth trajectory as it continues to capitalize on the higher market demand. Live Quote…
About the Company
Income Snapshot
Below shows the total revenue, net income and net margin for Euronav Nv. More…
| Total Revenues | Net Income | Net Margin |
| 1.08k | 421.67 | 34.4% |
Cash Flow Snapshot
Below shows the cash from operations, investing and financing for Euronav Nv. More…
| Operations | Investing | Financing |
| 502.85 | -203.64 | -255.34 |
Balance Sheet Snapshot
Below shows the total assets, liabilities and book value per share for Euronav Nv. More…
| Total Assets | Total Liabilities | Book Value Per Share |
| 4.08k | 1.74k | 11.58 |
Key Ratios Snapshot
Some of the financial key ratios for Euronav Nv are shown below. More…
| 3Y Rev Growth | 3Y Operating Profit Growth | Operating Margin |
| -1.1% | 3.1% | 46.8% |
| FCF Margin | ROE | ROA |
| -9.9% | 14.0% | 7.8% |
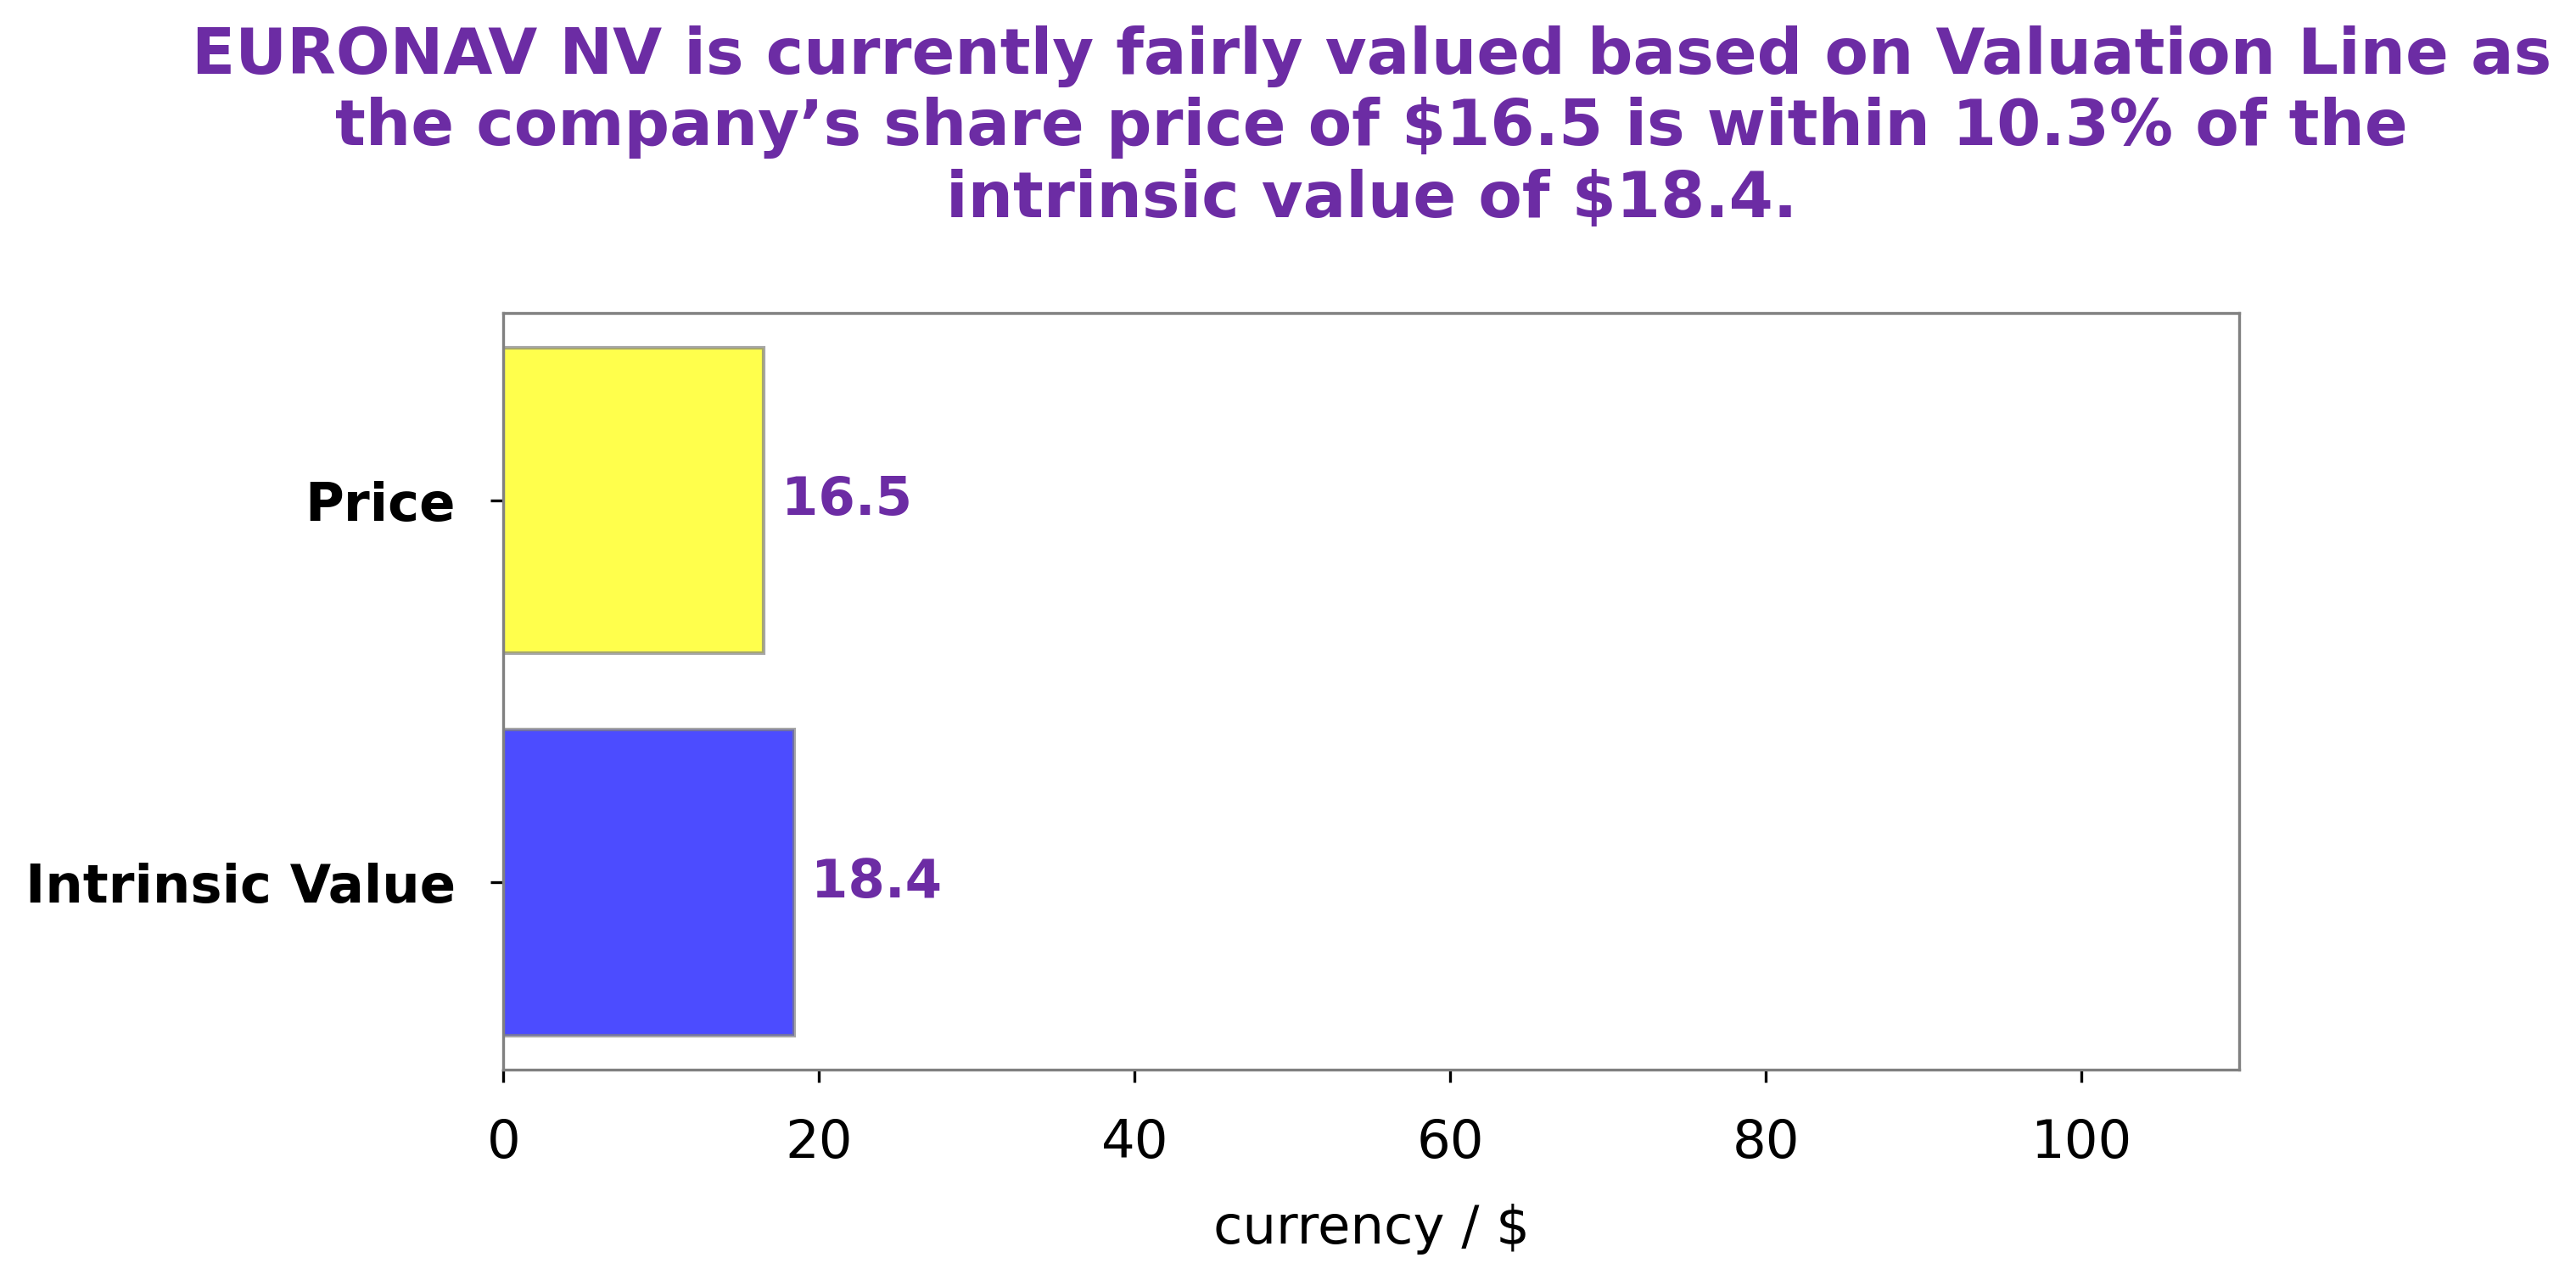
Analysis – Euronav Nv Stock Fair Value
GoodWhale recently analyzed the fundamentals of EURONAV NV with our proprietary tools. Our Valuation Line revealed that the fair value of EURONAV NV’s share is around $18.4. However, the stock is currently traded at $16.5, which is a fair price that is undervalued by 10.3%. Investors can potentially benefit from this discrepancy and consider buying EURONAV NV’s stock at a lower price than its fair value. More…
Peers
Its main competitors include Frontline PLC, International Seaways Inc, and Tsakos Energy Navigation Ltd. All four companies are fiercely competing to be the best in the business and to provide their customers with the highest quality services.
– Frontline PLC ($NYSE:FRO)
Frontline PLC is a leading logistics and transportation company based in the United Kingdom. With a market cap of 3.36B as of 2023, the company is well-positioned to take advantage of opportunities in the fast-growing sector. Frontline PLC’s Return on Equity (ROE) of 16.64% is indicative of the company’s strong financial performance and strong returns for its shareholders. The company provides freight forwarding, logistics, and transportation solutions to its customers spread across the globe. The company is committed to providing the highest level of service and quality to its customers.
– International Seaways Inc ($NYSE:INSW)
International Seaways Inc (INSW) is a leading U.S.-based global shipping company providing energy transportation services worldwide. As of 2023, it had a market cap of 1.93 billion dollars and a return on equity of 19.78%. Market capitalization is a measure of a company’s size and reflects the total value of its outstanding shares in the marketplace. It is an indicator of a company’s financial health, with a higher market cap reflecting greater investor confidence in that company’s future prospects. International Seaways’ return on equity is also a key measure of performance, referring to how efficiently a company is able to utilize its equity capital to generate income. This figure reflects the company’s ability to generate profits from its assets and investments.
– Tsakos Energy Navigation Ltd ($NYSE:TNP)
Tsakos Energy Navigation Ltd is a global provider of maritime transportation services that operates a fleet of product tankers, LNG/LPG carriers, and crude oil tankers. With a market cap of 527.27M as of 2023, Tsakos Energy Navigation Ltd is one of the most established companies in the maritime transportation services sector. The company has also demonstrated strong financial performance with a Return on Equity of 11.79% which is significantly higher than the industry average. These two indicators attest to the strength and stability of Tsakos Energy Navigation Ltd.
Summary
EURONAV NV reported impressive first quarter FY2023 financial results, ending March 31 2023, with revenue increasing by a significant 197.2% year-over-year to USD 340.0 million. Net income for the quarter was USD 175.0 million, a stark reversal of the previous year’s net loss of -43.4 million. This news had a positive impact on the stock price, which moved up the same day.
Analysts suggest that investors should consider buying into EURONAV NV at current prices due to the company’s improving financial position and attractive valuation. Longer-term investors may also benefit from potential upside from its diversified operations and new projects in the pipeline.


