EURONAV NV Reports Record Breaking Revenue Increase of 197.2% in Q1 FY2023
May 26, 2023

Earnings Overview
EURONAV NV ($BER:OCW) reported their earnings results for the first quarter of FY2023 on March 31, 2023, with total revenue at an impressive USD 340.0 million, an increase of 197.2% compared to the previous year. Net income was reported at USD 175.0 million along with a significant improvement from the -43.4 million reported the year before.
Analysis
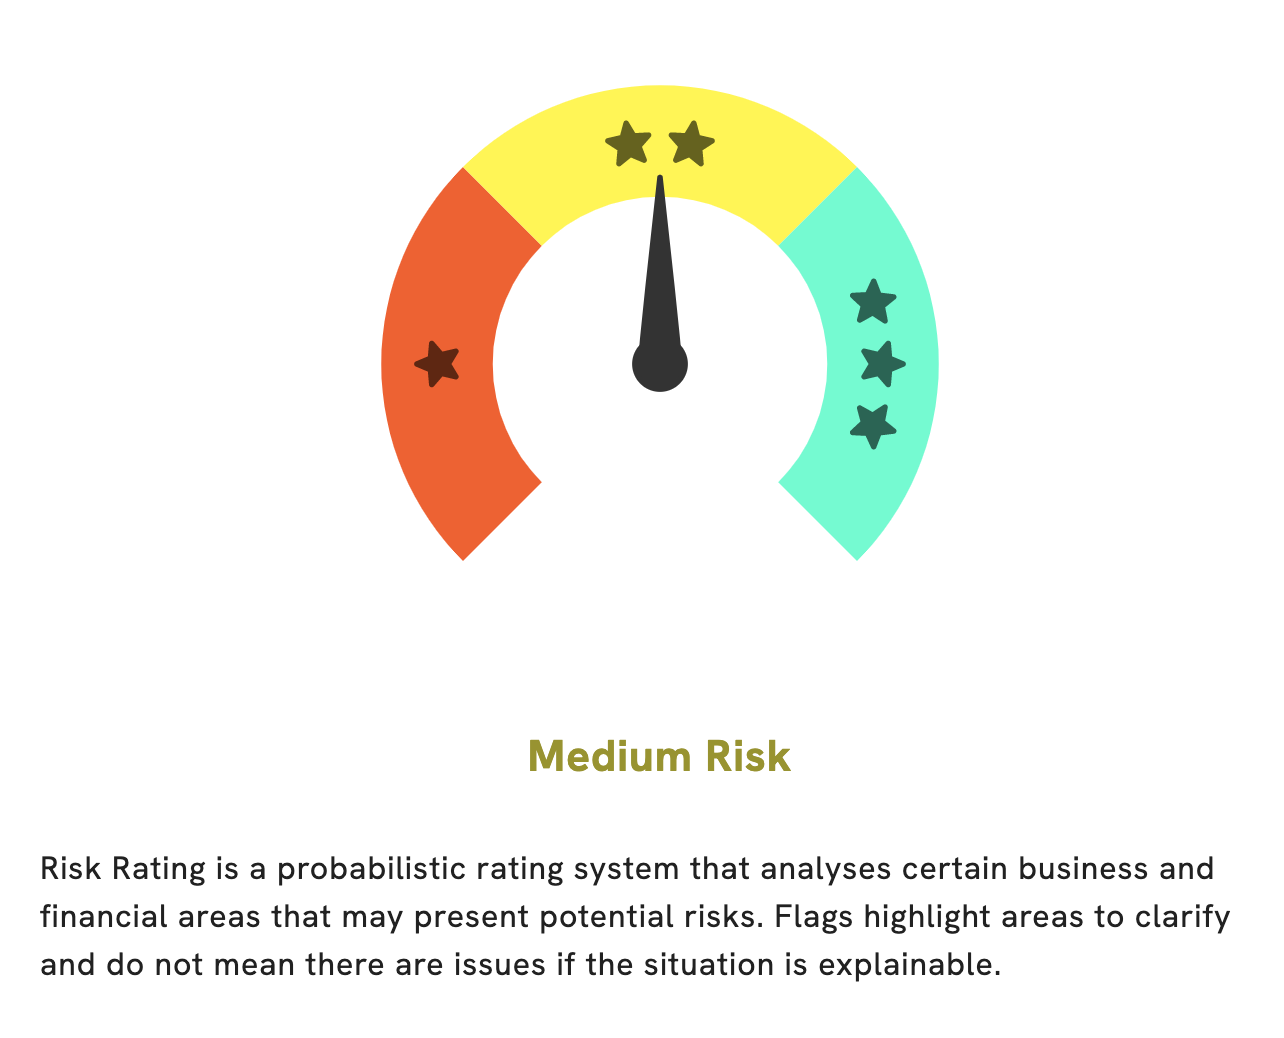
GoodWhale has completed a thorough analysis of EURONAV NV‘s fundamentals. According to our Risk Rating, EURONAV NV is a medium risk investment in terms of both financial and business aspects. Our analysis uncovered two risk warnings in the income sheet and balance sheet, and we encourage investors to register on goodwhale.com to take a closer look at these warnings. EURONAV NV is a company with a focus on the transportation of crude oil and petroleum products through its fleet of product carriers. It is headquartered in Belgium and operates in an industry characterized by volatility and highly competitive forces. Our analysis revealed that while the company has a strong asset base and a well-established position in the industry, there are some areas that warrant further scrutiny by potential investors. The income sheet and balance sheet both showed risk warnings, which can be seen by signing up with goodwhale.com. These warnings may indicate potential areas of concern that could impact financial performance in the future. For example, the income sheet shows a decline in revenue and profit margin from the previous fiscal year, while the balance sheet shows an increase in debt and liabilities. Overall, GoodWhale’s analysis concludes that EURONAV NV is a medium risk investment. Investors should take the time to consider the risk warnings present in the income sheet and balance sheet before making a decision about investing in the company. Additionally, GoodWhale encourages investors to register with our website to gain further insights into the company’s financials and risks. More…
About the Company
Income Snapshot
Below shows the total revenue, net income and net margin for Euronav Nv. More…
| Total Revenues | Net Income | Net Margin |
| 1.08k | 421.67 | 34.4% |
Cash Flow Snapshot
Below shows the cash from operations, investing and financing for Euronav Nv. More…
| Operations | Investing | Financing |
| 502.85 | -203.64 | -255.34 |
Balance Sheet Snapshot
Below shows the total assets, liabilities and book value per share for Euronav Nv. More…
| Total Assets | Total Liabilities | Book Value Per Share |
| 4.08k | 1.74k | 11.58 |
Key Ratios Snapshot
Some of the financial key ratios for Euronav Nv are shown below. More…
| 3Y Rev Growth | 3Y Operating Profit Growth | Operating Margin |
| -1.1% | 3.1% | 46.8% |
| FCF Margin | ROE | ROA |
| -9.9% | 14.0% | 7.8% |

Summary
EURONAV NV has seen a remarkable increase in total revenue in the first quarter of 2023. Total revenue reached USD 340.0 million, a 197.2% increase from the same period a year prior. Net income reported for this quarter was USD 175.0 million, a significant improvement from the -43.4 million the year prior. These strong earnings results signal that EURONAV NV is continuing to make strides in their financial performance, making it an attractive investment option for investors looking for growth and stability.
Recent Posts


