Cooper Companies Reports 5.7% YOY Revenue Increase for Q2 of FY2023 with Total Earnings of USD 877.4 Million
June 23, 2023

☀️Earnings Overview
COOPER ($NYSE:COO): Unfortunately, net income for the period was USD 39.8 million, a 68.6% decrease year-over-year.
Analysis
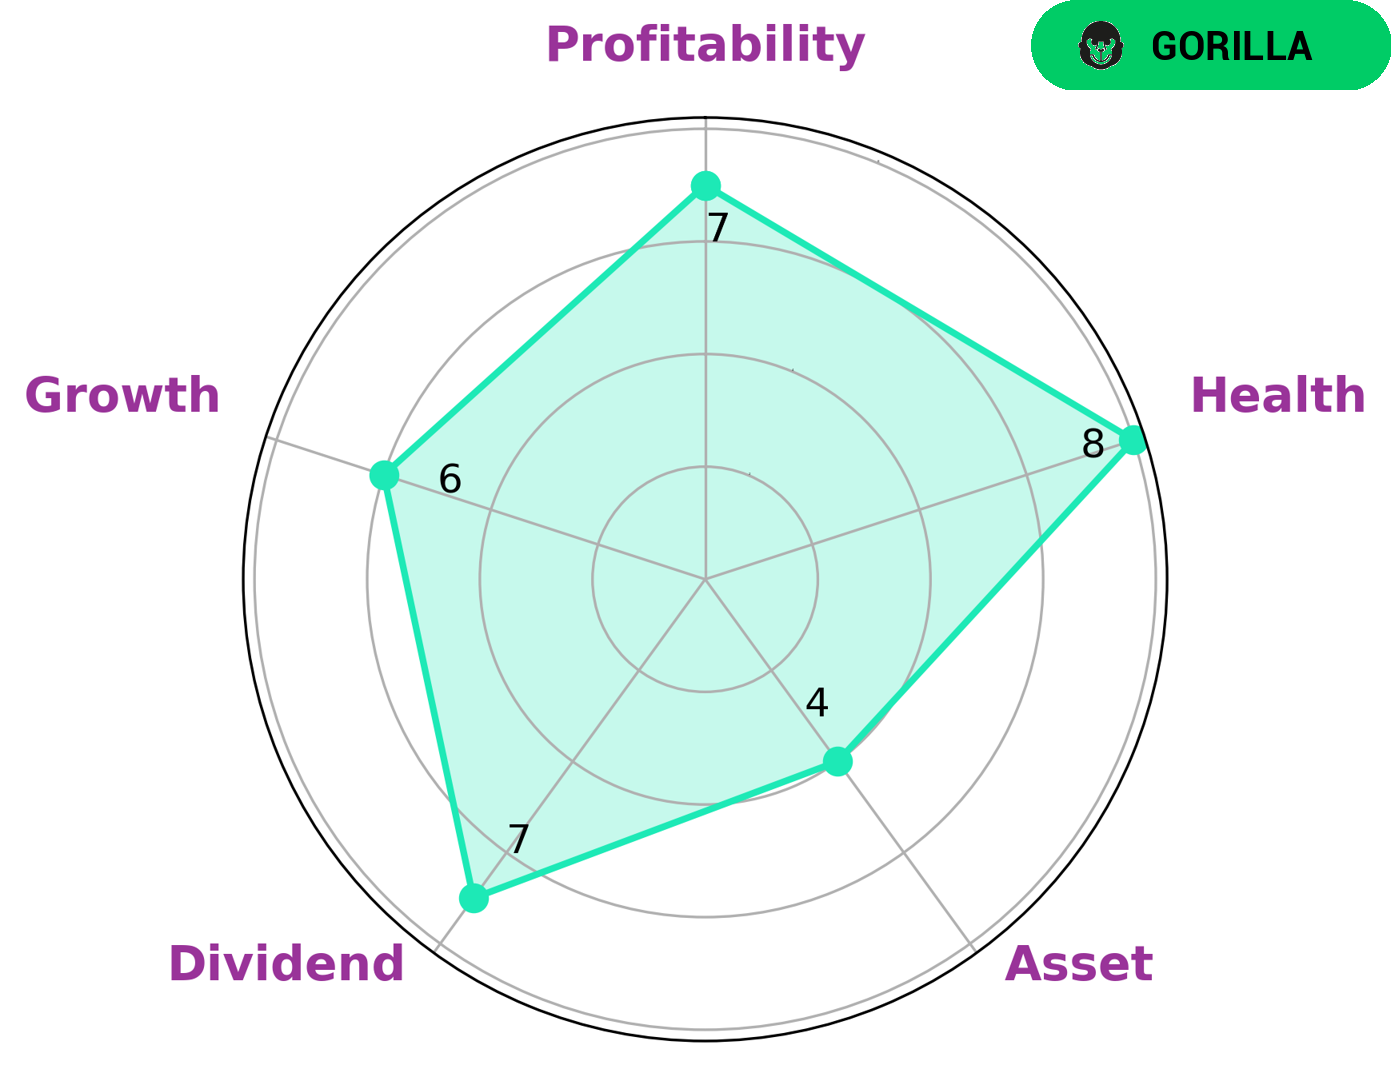
GoodWhale conducted an analysis of the financials of COOPER COMPANIES. The Star Chart shows that COOPER COMPANIES is strong in dividend, profitability, and medium in asset and growth. As a result, COOPER COMPANIES is classified as a ‘rhino’ type of company, which we conclude has achieved moderate revenue or earnings growth. Investors who are looking for steady income or cash flow from dividends may be interested in investing in COOPER COMPANIES. The company also has a high health score of 8/10 with regard to its cashflows and debt, indicating that it is capable of sustaining future operations in times of crisis. Therefore, investors looking for a secure long-term investment may be drawn to COOPER COMPANIES. More…
About the Company
Income Snapshot
Below shows the total revenue, net income and net margin for Cooper Companies. More…
| Total Revenues | Net Income | Net Margin |
| 3.43k | 288.4 | 8.7% |
Cash Flow Snapshot
Below shows the cash from operations, investing and financing for Cooper Companies. More…
| Operations | Investing | Financing |
| 685.4 | -341.5 | -627.2 |
Balance Sheet Snapshot
Below shows the total assets, liabilities and book value per share for Cooper Companies. More…
| Total Assets | Total Liabilities | Book Value Per Share |
| 11.54k | 4.16k | 149.18 |
Key Ratios Snapshot
Some of the financial key ratios for Cooper Companies are shown below. More…
| 3Y Rev Growth | 3Y Operating Profit Growth | Operating Margin |
| 10.5% | 4.5% | 13.7% |
| FCF Margin | ROE | ROA |
| 11.3% | 4.0% | 2.5% |
Peers
The Cooper Companies Inc and its competitors, Sonova Holding AG, Pfizer Inc, and Teleflex Inc, compete in the global medical device market. Sonova Holding AG is a leading manufacturer of hearing aids and other auditory products. Pfizer Inc is a leading manufacturer of pharmaceuticals, vaccines, and other health care products. Teleflex Inc is a leading manufacturer of medical devices and other health care products.
– Sonova Holding AG ($LTS:0QPY)
Sonova Holding AG is a global leader in providing hearing care solutions. The company has a market capitalization of 15.4 billion as of 2022 and a return on equity of 21.26%. Sonova’s products are sold in over 100 countries and the company has a strong presence in Europe, North America, and Asia Pacific. The company’s products include hearing aids, cochlear implants, and wireless communication solutions.
– Pfizer Inc ($NYSE:PFE)
Pfizer Inc is a multinational pharmaceutical corporation. It is one of the world’s largest pharmaceutical companies. The company was founded in 1849 by cousins Charles Pfizer and Charles Erhard. The company has its headquarters in New York City.
Pfizer’s market cap is $270.73 billion as of 2022. Its return on equity is 27.98%. The company manufactures and sells a broad range of pharmaceutical products, including prescription and over-the-counter drugs. The company’s products are sold in more than 150 countries.
– Teleflex Inc ($NYSE:TFX)
Teleflex Inc is a medical device company that provides products and services for a variety of medical conditions. The company has a market cap of 10.2B as of 2022 and a Return on Equity of 8.5%. Teleflex Inc’s products and services include catheters, respiratory devices, and surgical instruments. The company serves patients, families, and healthcare professionals worldwide.
Summary
COOPER COMPANIES released their second quarter FY2023 results for the period ending April 30 2023, with total revenue increasing by 5.7% year-over-year to USD 877.4 million. Despite this revenue growth, net income decreased by 68.6% year-over-year to USD 39.8 million, indicating a weakening performance in the quarter. Investment analysts recommend that potential investors should carefully consider these results when making an investment decision. Further analysis on potential risks and returns should be carried out to determine whether investing in COOPER COMPANIES is a viable option.
Related Posts


Recent Posts


Investing Everyone Can Do.
Investing shouldn’t be exclusive to a select few. We believe everyone should have the opportunity to grow their wealth. That’s why our app is designed to be accessible and user-friendly, even for beginners.
