BRIGHTVIEW HOLDINGS Reports Q1 Earnings Results for FY2023 as of December 31, 2022
March 27, 2023

Earnings Overview
On February 7 2023, BRIGHTVIEW HOLDINGS ($NYSE:BV) reported their Q1 earnings results for the financial year 2023, ending December 31 2022. Compared to the same period in the previous year, total revenue declined by 47.7% to USD -18.9 million. Net income, however, rose 10.8% to USD 655.9 million.
Transcripts Simplified
BrightView Holdings reported strong Q1 results, with total revenue up 10.8% and adjusted EBITDA up 14%, driven by organic growth of 5.5%, M& A contributions of $21 million and $11 million, respectively. Maintenance revenue increased 10.3%, driven by 1.5% land organic growth and 50.5% snow organic growth, while Development revenue increased 12.7%, driven by 5.9% organic growth. Profitability also increased, with adjusted EBITDA margins expanding 20 basis points in the Maintenance segment and 10 in the Development segment.
Corporate expenses represented 2.8% of revenue, implying a 10 basis point improvement relative to the prior year. BrightView is optimistic about the potential for continued margin improvement in the Development segment in fiscal ’23.
About the Company
Income Snapshot
Below shows the total revenue, net income and net margin for Brightview Holdings. More…
| Total Revenues | Net Income | Net Margin |
| 2.84k | 7.9 | 0.3% |
Cash Flow Snapshot
Below shows the cash from operations, investing and financing for Brightview Holdings. More…
| Operations | Investing | Financing |
| 99.7 | -195 | -15.1 |
Balance Sheet Snapshot
Below shows the total assets, liabilities and book value per share for Brightview Holdings. More…
| Total Assets | Total Liabilities | Book Value Per Share |
| 3.33k | 2.13k | 13.08 |
Key Ratios Snapshot
Some of the financial key ratios for Brightview Holdings are shown below. More…
| 3Y Rev Growth | 3Y Operating Profit Growth | Operating Margin |
| 5.0% | -8.1% | 2.8% |
| FCF Margin | ROE | ROA |
| -0.2% | 4.1% | 1.5% |
Price History
On Tuesday, BRIGHTVIEW HOLDINGS reported their first quarter earnings results for the Fiscal Year 2023, as of December 31, 2022. As a result of the announcement, the stock opened at $7.8 but dropped to $6.5 by the end of the day, representing a plunge of 21.8% from the prior closing price of 8.3. This unexpected drop in stock prices could be attributed to investors’ reactions to the company’s performance for the quarter. The company reported lower-than-expected revenue, as well as lower profits than had been anticipated. The decrease in revenue was driven by decreases in sales from both domestic and international markets, as well as lower average selling prices.
Additionally, operating expenses exceeded expectations due to higher than expected costs associated with research and development investments. Despite the disappointing report, BRIGHTVIEW HOLDINGS executives remain confident in the company’s long-term prospects. They believe that the company has the right strategies in place to move forward and continue to deliver growth and increased stock value over the coming years. In order to achieve this goal, they will be focusing on improving operational efficiency and expanding their product offerings. Additionally, they are committed to increasing their brand presence by investing in marketing and promotional activities. Overall, BRIGHTVIEW HOLDINGS has had a challenging start to their fiscal year but they have expressed strong confidence in their ability to succeed in the future. Investors may want to keep a close eye on the company’s progress moving forward as it will be critical for them to turn things around in order to bring the stock price back up. Live Quote…
Analysis
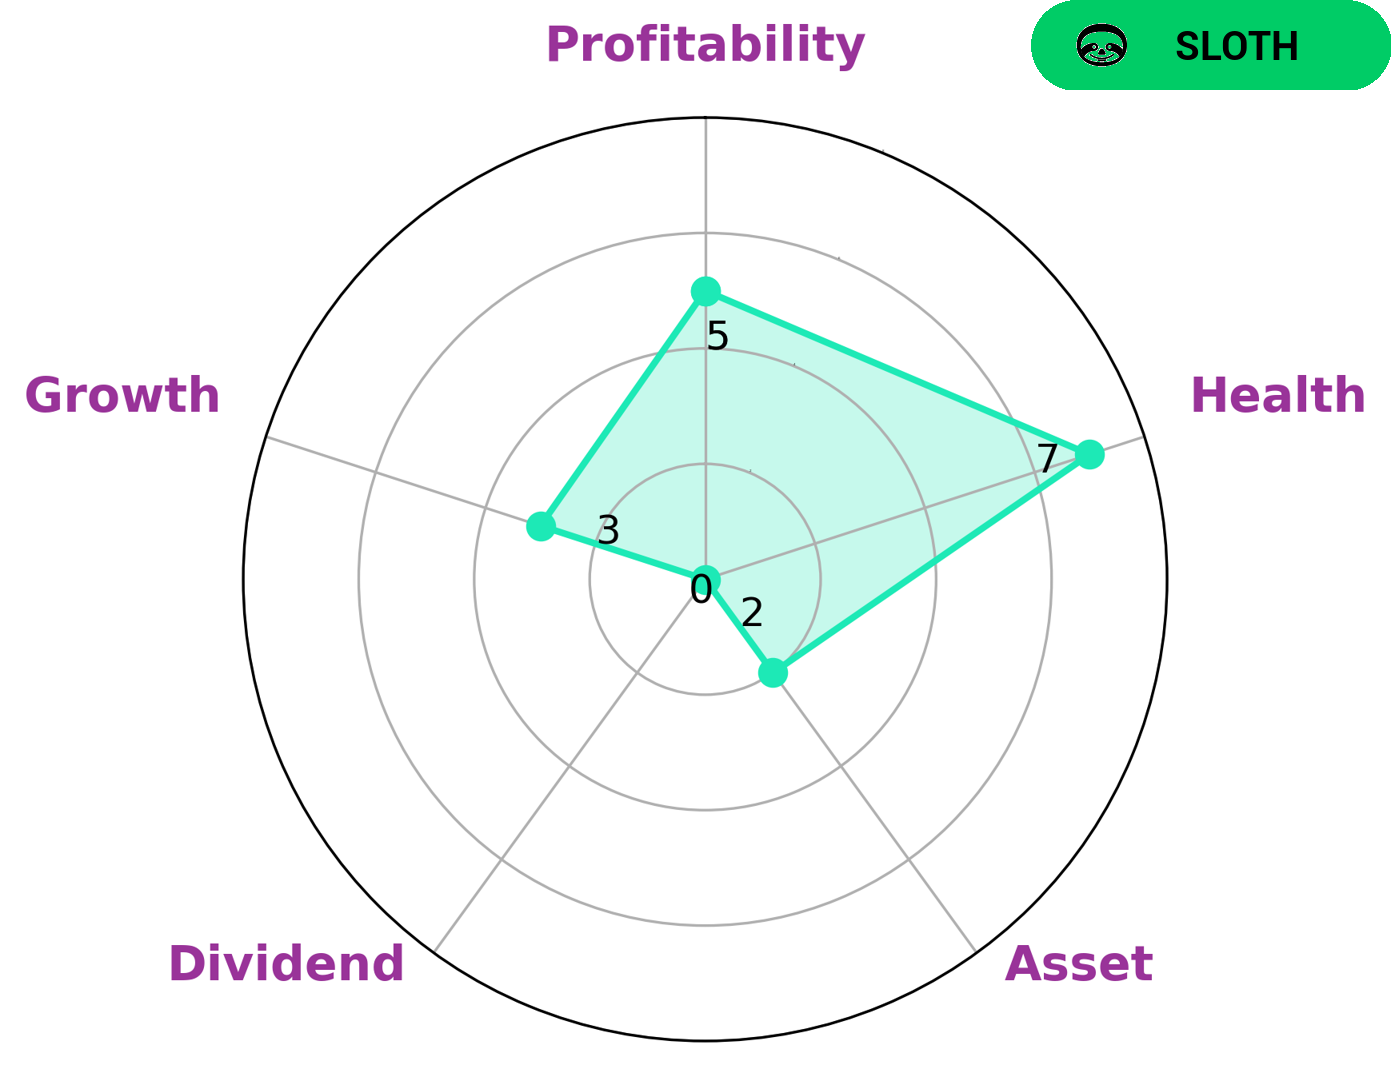
At GoodWhale, we have conducted an analysis of BRIGHTVIEW HOLDINGS‘s wellbeing. Our Star Chart shows that BRIGHTVIEW HOLDINGS is strong in, medium in profitability and weak in asset, dividend, growth. Furthermore, BRIGHTVIEW HOLDINGS has a high health score of 7/10 considering its cashflows and debt, meaning that it is capable to pay off debt and fund future operations. After examining the performance of BRIGHTVIEW HOLDINGS, we have classified it as a ‘sloth’ company – one that has achieved revenue or earnings growth slower than the overall economy. This type of company may be attractive to value-oriented investors who are looking for promising investments with long-term potential. They may also be attractive to risk-averse investors as they are considered to be a safe bet in terms of long-term return on investment. Ultimately, it can be seen that BRIGHTVIEW HOLDINGS has potential to turn into a profitable investment over time. More…
Peers
The competition between BrightView Holdings Inc and its competitors is fierce, with Mader Group Ltd, Japan Elevator Service Holdings Co Ltd, and Simplex Holdings Inc all vying for a share of the market. With each company offering unique products and services, the competition is sure to be fierce in the coming years.
– Mader Group Ltd ($ASX:MAD)
Mader Group Ltd is a global engineering services provider based in Australia. The company provides turnkey engineering, project management and maintenance services to clients in the resources, energy, infrastructure and industrial sectors across the globe. As of 2022, the company has a market cap of 704M and a Return on Equity (ROE) of 33.68%. The market cap reflects the market value of the company and its shareholders’ equity, while the ROE is an indicator of how well the company is utilizing its shareholders’ investments. Mader Group’s high ROE suggests that it has been able to produce high returns for its shareholders.
– Japan Elevator Service Holdings Co Ltd ($TSE:6544)
Elevator Service Holdings Co Ltd is a Japanese company that specializes in the manufacturing and installation of elevators, escalators, and moving walkways. With a market cap of 141.94B as of 2022, the company is well-positioned to remain a leader in the industry. The company has also shown strong financial performance, with a Return on Equity of 24.68%. This indicates that the company is effective in utilizing its assets to generate profits. The company’s strong market position and financial performance make it well-positioned to remain a leader in the industry.
– Simplex Holdings Inc ($TSE:4373)
Simplex Holdings Inc is a leading technology company that designs and manufactures products for the consumer electronics and automotive industries. It is listed on the NYSE and has a market cap of 118.08B as of 2022. The company’s Return on Equity (ROE) stands at 10.23%, indicating that its shareholders earned 10.23 cents for each dollar of shareholders’ equity invested in the company. This is a sign of strong performance and a well-managed business. Simplex Holdings Inc has been able to successfully capitalize on the growing demand for consumer electronics and automotive products, allowing it to become one of the largest players in the sector.
Summary
BRIGHTVIEW HOLDINGS recently reported their FY2023 Q1 earnings results for the period ending December 31 2022. Total revenue for the quarter was USD -18.9 million, a decrease of 47.7% year-on-year, while net income increased 10.8% to USD 655.9 million. Despite the decrease in revenue, investors were encouraged by the increase in net income and this was reflected in a slight decrease in the stock price. For investors looking at BRIGHTVIEW HOLDINGS, it is important to look at their progress in terms of both top-line and bottom-line growth, as well as their cost-cutting and cash flow management strategies.
Related Posts


Recent Posts


Investing Everyone Can Do.
Investing shouldn’t be exclusive to a select few. We believe everyone should have the opportunity to grow their wealth. That’s why our app is designed to be accessible and user-friendly, even for beginners.
