Bilibili Inc Intrinsic Value Calculation – BILIBILI INC Reports Strong Third Quarter Earnings for Fiscal Year 2023
December 11, 2023

☀️Earnings Overview
For the third quarter of its fiscal year 2023, BILIBILI INC ($NASDAQ:BILI) reported total revenue of CNY 5805.1 million, which was an increase of 0.2% from the same period the year before. The company’s net income for the quarter was CNY -1351.4 million, a decrease from -1713.4 million in the corresponding quarter of the previous year.
Market Price
However, despite the strong performance, the stock opened at $12.9 and closed at $11.9, plunge by 11.1% from its previous closing price of 13.3. The company attributed the decline in stock prices to a number of factors, including a sudden shift in the market sentiment, as investors began to reject high growth stocks in favor of more traditional companies.
In addition, BILIBILI INC also had to cope with the impact of the pandemic on their operations, including reduced advertising revenues due to decreased consumer spending. Despite the drop in stock prices, analysts remain optimistic about BILIBILI INC’s future outlook. They highlighted the strong performance of the company’s core business segments, which saw a surge in profits driven by increased user activity and engagement. Furthermore, BILIBILI INC’s investments in new technologies such as artificial intelligence and machine learning have also yielded positive returns on investment, which investors are beginning to recognize. All in all, although there was a dip in stock prices on Wednesday, BILIBILI INC still reported impressive third quarter earnings and has a bright future ahead. With its strong performance and strategic investments in technological advancement, BILIBILI INC is well-positioned to capitalize on the growing demand for online streaming services and other digital content. Live Quote…
About the Company
Income Snapshot
Below shows the total revenue, net income and net margin for Bilibili Inc. More…
| Total Revenues | Net Income | Net Margin |
| 22.32k | -5.02k | -25.0% |
Cash Flow Snapshot
Below shows the cash from operations, investing and financing for Bilibili Inc. More…
| Operations | Investing | Financing |
| -2.46k | 10.61k | -4.35k |
Balance Sheet Snapshot
Below shows the total assets, liabilities and book value per share for Bilibili Inc. More…
| Total Assets | Total Liabilities | Book Value Per Share |
| 33.9k | 18.42k | 37.59 |
Key Ratios Snapshot
Some of the financial key ratios for Bilibili Inc are shown below. More…
| 3Y Rev Growth | 3Y Operating Profit Growth | Operating Margin |
| 30.0% | – | -21.1% |
| FCF Margin | ROE | ROA |
| -21.8% | -18.4% | -8.7% |
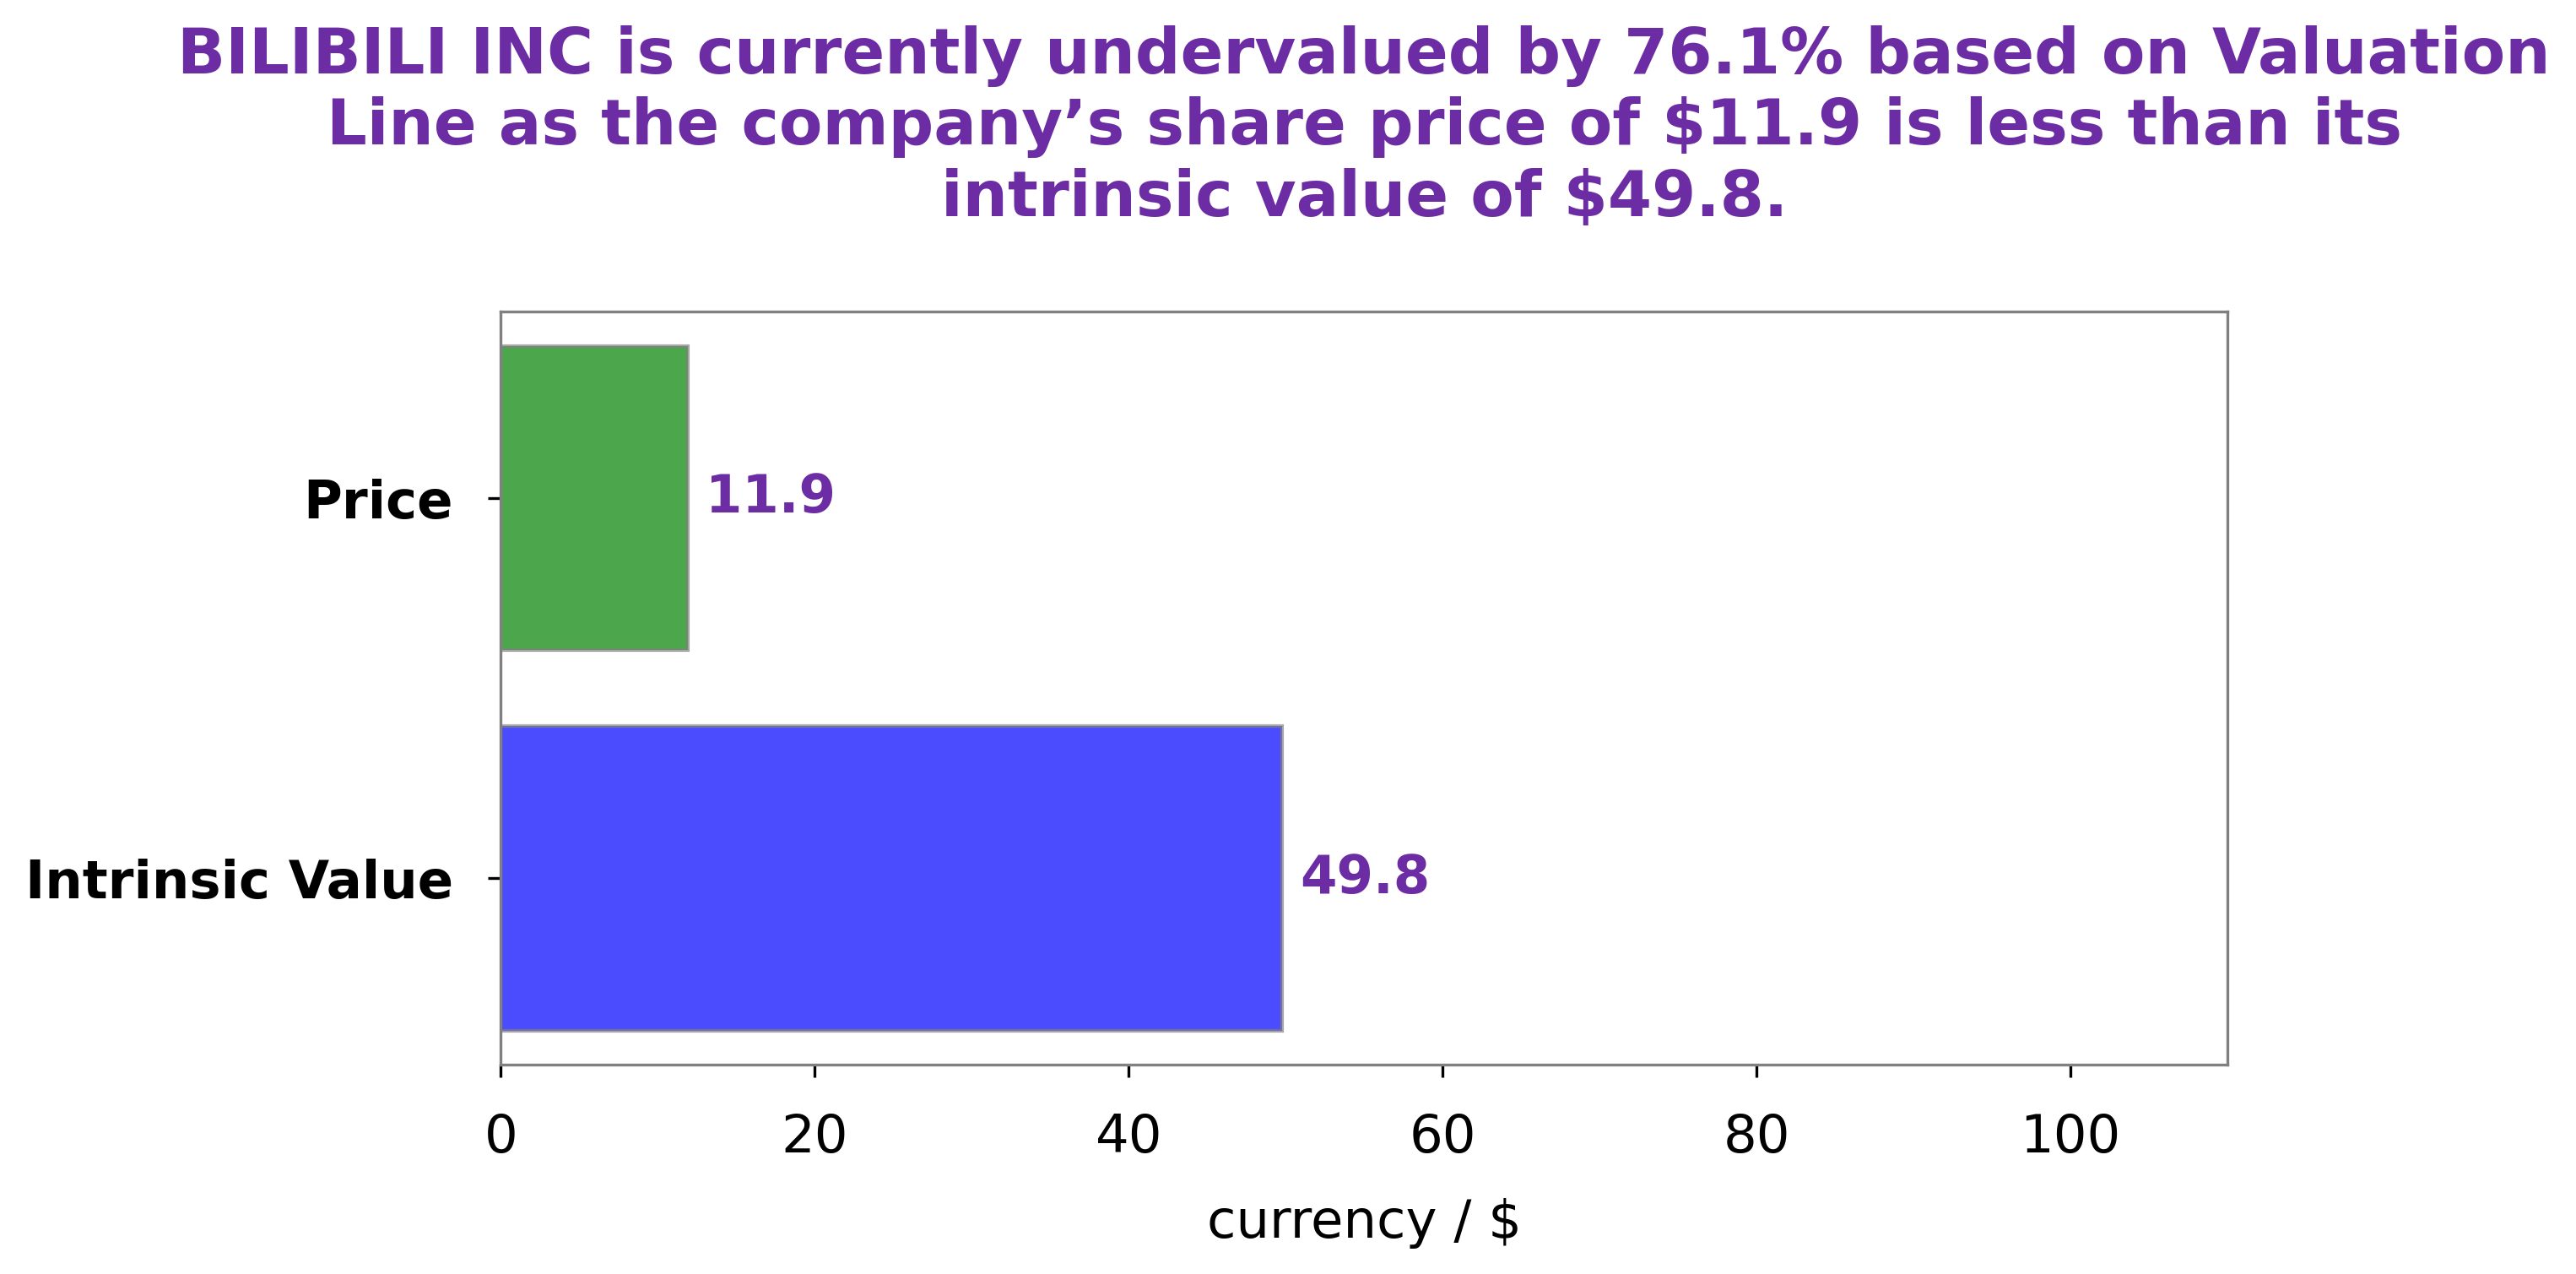
Analysis – Bilibili Inc Intrinsic Value Calculation
At GoodWhale, we have conducted an analysis of BILIBILI INC‘s wellbeing. According to our calculations, the fair value of BILIBILI INC’s shares is estimated at around $49.8. This was calculated using our proprietary Valuation Line. Currently, BILIBILI INC’s stock is being traded at a price of $11.9, which means it is undervalued by 76.1%. This offers a great opportunity for investors looking to capitalise on an undervalued stock. More…
Summary
BILIBILI Inc reported its earnings results for the third quarter of fiscal year 2023, showing total revenue of CNY 5805.1 million and net income of CNY -1351.4 million. As a result, BILIBILI Inc’s stock price moved down the same day. Investors should consider the latest results when analyzing the company, as well as its current financial health, business model, competitive landscape, and future prospects. Additionally, potential investors should research the company’s management team to get an understanding of their strategy.
Related Posts


Recent Posts


Investing Everyone Can Do.
Investing shouldn’t be exclusive to a select few. We believe everyone should have the opportunity to grow their wealth. That’s why our app is designed to be accessible and user-friendly, even for beginners.
