ATI INC Reports Profitable Q2 Earnings for FY2023
August 4, 2023

☀️Earnings Overview
ATI INC ($NYSE:ATI) released their Q2 FY2023 earnings report, which ended on June 30th 2023; total revenue for the quarter was USD 1046.0 million, indicating a 9.0% increase from the same period a year prior. Net income was reported at USD 76.0 million, significantly higher than the -38.0 million loss in the same period of the prior year.
Stock Price
ATI Inc, a leading provider of information technology solutions, reported strong results in its second quarter of the fiscal year 2023. On Wednesday, the company’s stock opened at $45.8 and closed the trading day at $45.1, down 3.9% from its previous closing price of $46.9. In a statement, ATI Inc’s CEO, Jeff Merrick, highlighted the success of the company’s innovative products and services. He said, “We are pleased to report a profitable quarter of growth, driven by strong demand for our products and services.”
Merrick also commented on the company’s strategic investments, noting that they are “positioning us for continued success in the future.” Overall, ATI Inc’s performance in Q2 FY2023 is encouraging for investors and demonstrates the company’s ability to innovate and become more efficient. Going forward, ATI Inc is expected to continue to build on its success and remain a leader in the IT solutions sector. Live Quote…
About the Company
Income Snapshot
Below shows the total revenue, net income and net margin for Ati Inc. More…
| Total Revenues | Net Income | Net Margin |
| 4.13k | 284.1 | 7.3% |
Cash Flow Snapshot
Below shows the cash from operations, investing and financing for Ati Inc. More…
| Operations | Investing | Financing |
| 230.2 | -171.8 | -65.3 |
Balance Sheet Snapshot
Below shows the total assets, liabilities and book value per share for Ati Inc. More…
| Total Assets | Total Liabilities | Book Value Per Share |
| 4.43k | 3.13k | 9.29 |
Key Ratios Snapshot
Some of the financial key ratios for Ati Inc are shown below. More…
| 3Y Rev Growth | 3Y Operating Profit Growth | Operating Margin |
| 3.1% | 13.9% | 9.7% |
| FCF Margin | ROE | ROA |
| 1.2% | 21.7% | 5.6% |
Analysis
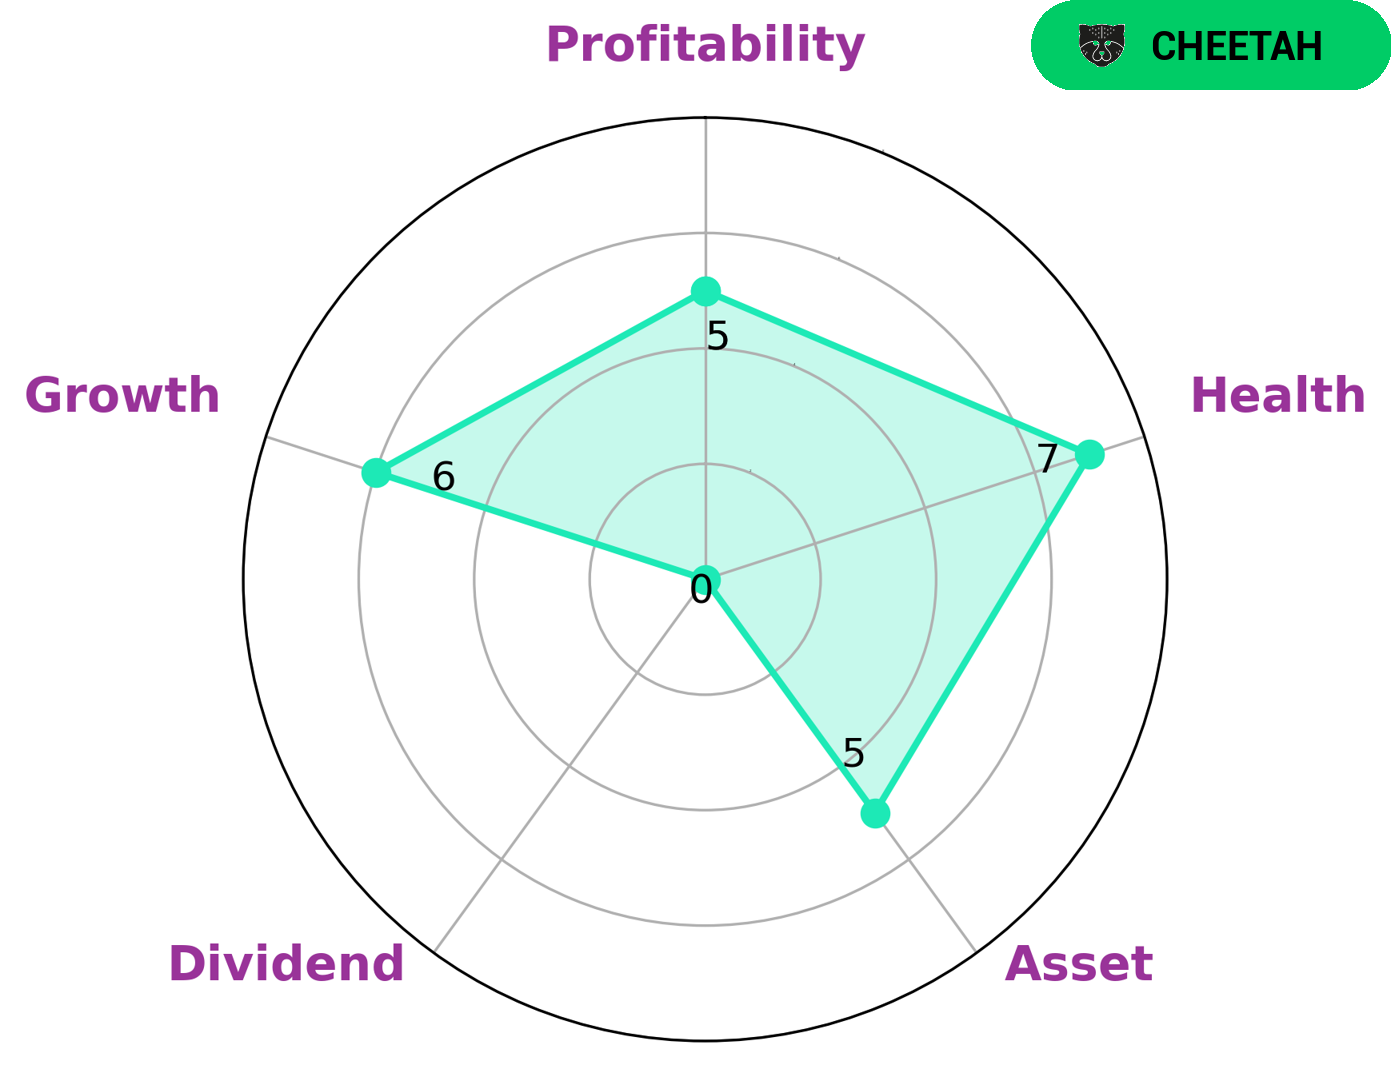
GoodWhale recently conducted an analysis of ATI INC‘s wellbeing. After running a Star Chart analysis on the company, we found that ATI INC is strong in asset, growth, and profitability, but weak in dividend. From this, we can classify ATI INC as a ‘Cheetah’ type company; one that achieves high revenue or earnings growth but is considered less stable due to lower profitability. Given these characteristics, the type of investors who may be interested in ATI INC would be those looking for investments with higher levels of potential risk, yet potentially higher returns. Despite the higher levels of risk associated with this type of company, ATI INC has a very good health score of 8 out of 10, indicating that it would be capable to safely ride out any crisis without the risk of bankruptcy. More…
Peers
Its products are used in a wide range of industries, including aerospace and defense, oil and gas, chemical processing, power generation, and medical. ATI has a diversified customer base and a strong competitive position in its markets. The company’s competitors include Luxfer Holdings PLC, Morgan Advanced Materials PLC, and Thermodynetics Inc.
– Luxfer Holdings PLC ($NYSE:LXFR)
Luxfer Holdings PLC is a global materials technology company specializing in the design and manufacture of high-performance materials, primarily for the transportation, healthcare, and industrial markets. The company has a market capitalization of 410.85 million as of 2022 and a return on equity of 13.01%. Luxfer’s products are used in a variety of applications, including aircraft, automobiles, medical devices, and industrial gas cylinders.
– Morgan Advanced Materials PLC ($LSE:MGAM)
Morgan Advanced Materials PLC is a world leader in advanced materials science and engineering. They develop and manufacture materials and components for some of the most demanding applications across a range of industries, from aerospace and defense to healthcare and energy. With a history dating back over 180 years, they have a global network of over 100 manufacturing, research and development facilities in more than 30 countries.
Morgan Advanced Materials PLC has a market cap of 868.95M as of 2022. The company has a Return on Equity of 22.47%. Morgan Advanced Materials PLC develops and manufactures materials and components for some of the most demanding applications across a range of industries, from aerospace and defense to healthcare and energy.
– Thermodynetics Inc ($OTCPK:TDYT)
Thermodynetics Inc is a company that specializes in the production of heat transfer equipment. The company has a market capitalization of 97.5 thousand as of 2022 and a return on equity of 831.89%. The company’s products are used in a variety of industries, including automotive, aerospace, and power generation.
Summary
Investors in ATI INC had a bumpy quarter with the company reporting total revenue of USD 1046.0 million, a 9.0% year-on-year increase, and net income of USD 76.0 million, compared to a loss of -38.0 million in the same period last year. Despite these results, stock price moved down the same day, likely due to investor expectations that the company’s performance would be better. Nevertheless, this may present an attractive buying opportunity for investors, as ATI INC still has potential to make further gains in the short-term.
Related Posts


Recent Posts


Investing Everyone Can Do.
Investing shouldn’t be exclusive to a select few. We believe everyone should have the opportunity to grow their wealth. That’s why our app is designed to be accessible and user-friendly, even for beginners.
