ARTHUR J. GALLAGHER & Co. Releases Second Quarter Earnings Report for Fiscal 2023
August 3, 2023

🌥️Earnings Overview
ARTHUR J. GALLAGHER & ($NYSE:AJG) Co. reported total revenue of USD 2441.9 million for the second quarter of fiscal 2023, a 19.5% increase compared to the same period in the prior year. However, net income for the quarter decreased 17.5% year over year, and was USD 234.5 million. The quarter ended on July 27, 2023.
Stock Price
On Thursday, ARTHUR J. GALLAGHER & Co. stock opened at $220.2 and closed at $217.2, down by 1.2% from last closing price of 219.8. This came after the company announced their second quarter earnings report for fiscal 2023. The company also reported increased operating margins and a continued focus on improving efficiency and cost control.
This positive performance was attributed to the company’s successful initiatives, such as their strategic acquisitions and the continued focus on customer service. Investors responded positively to the news and drove the stock price down 1.2% from the opening price by the end of trading on Thursday. Live Quote…
About the Company
Income Snapshot
Below shows the total revenue, net income and net margin for AJG. More…
| Total Revenues | Net Income | Net Margin |
| 9.21k | 1.11k | 13.3% |
Cash Flow Snapshot
Below shows the cash from operations, investing and financing for AJG. More…
| Operations | Investing | Financing |
| 2.34k | -1k | -522.8 |
Balance Sheet Snapshot
Below shows the total assets, liabilities and book value per share for AJG. More…
| Total Assets | Total Liabilities | Book Value Per Share |
| 54.37k | 43.93k | 48.24 |
Key Ratios Snapshot
Some of the financial key ratios for AJG are shown below. More…
| 3Y Rev Growth | 3Y Operating Profit Growth | Operating Margin |
| 9.7% | 27.8% | 19.0% |
| FCF Margin | ROE | ROA |
| 23.5% | 10.8% | 2.0% |
Analysis
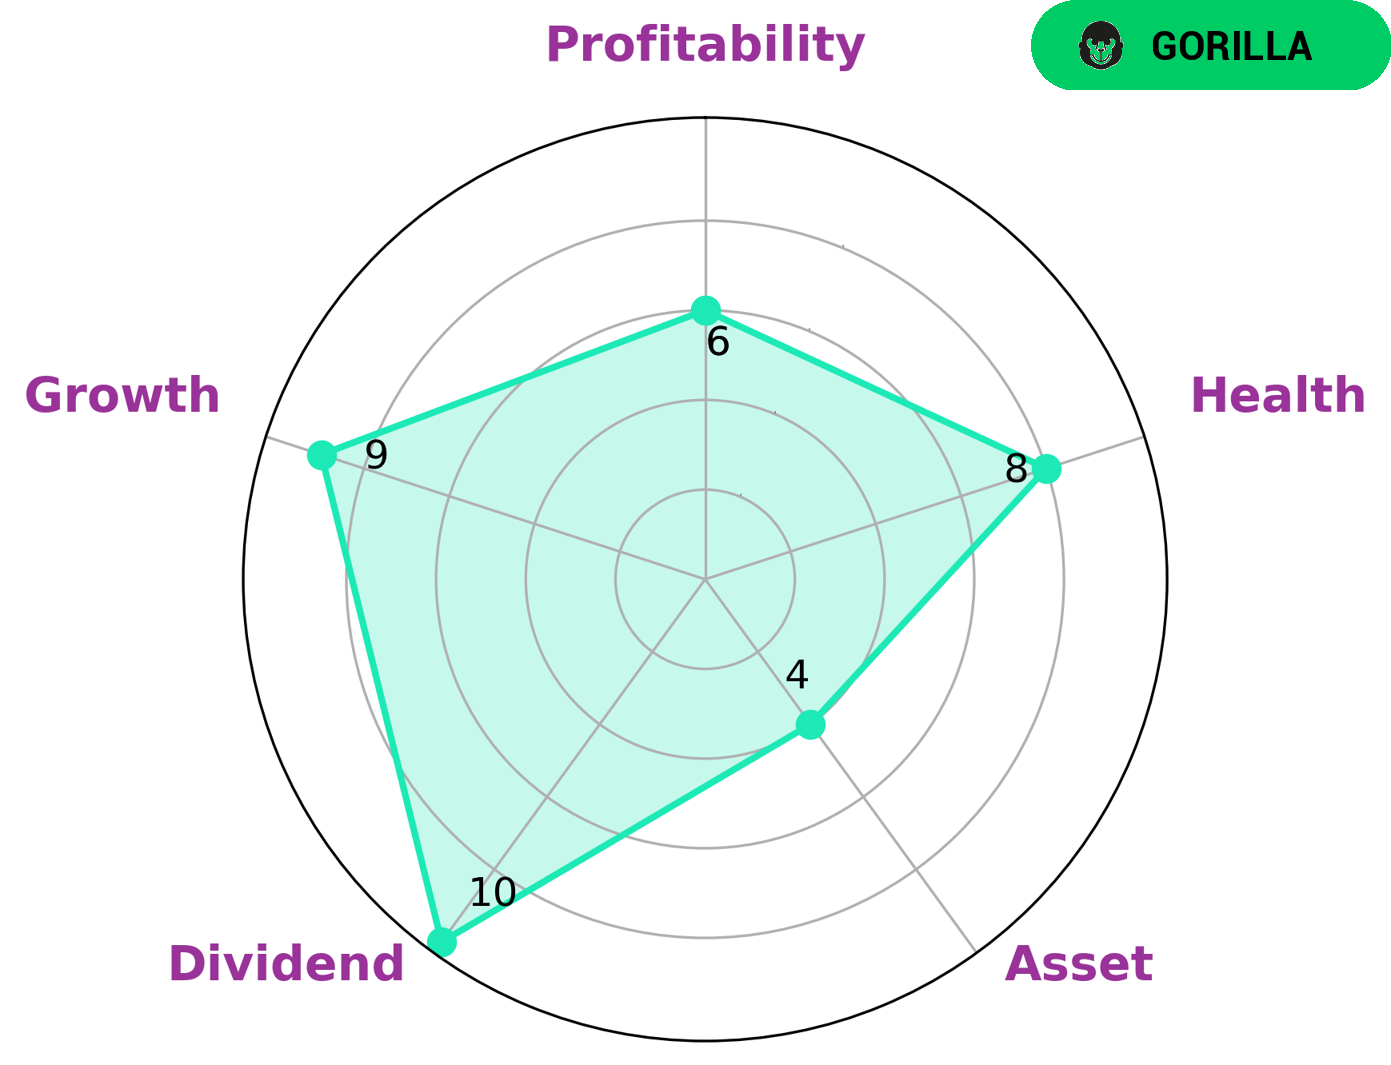
At GoodWhale, we analyzed ARTHUR J. GALLAGHER & Co’s wellbeing and found that they are quite strong in dividend, growth, and medium in asset and profitability. According to our Star Chart, ARTHUR J. GALLAGHER & Co scored 8/10 in health, meaning they are capable of paying off debt and funding future operations. We have classified ARTHUR J. GALLAGHER & Co as a ‘gorilla’ type of company; one that has achieved stable and high revenue or earning growth due to its strong competitive advantage. This type of company is attractive to many types of investors, such as value investors, dividend investors, growth investors, and long-term investors. These investors can benefit from ARTHUR J. GALLAGHER & Co due to its strong dividend yield, potential for growth, and capability of paying off debt. More…
Peers
The insurance brokerage industry is highly competitive, with Arthur J. Gallagher & Co competing against Brown & Brown Inc, Argentum 47 Inc, and Ensurance Ltd. These companies are all vying for market share in the insurance brokerage industry, which is worth billions of dollars.
– Brown & Brown Inc ($NYSE:BRO)
Brown & Brown, Inc. is a diversified insurance agency, brokerage, and service company. It offers insurance products and services for individuals, families, and businesses in the areas of property and casualty, life and health, and employee benefits. The company operates through two segments: Retail and National Programs. The Retail segment offers a range of insurance products and services to individuals, families, and businesses through a network of over 200 offices in the United States. The National Programs segment provides insurance coverage to affinity groups, trade associations, and other groups through a variety of program administrators. Brown & Brown, Inc. was founded in 1939 and is headquartered in Daytona Beach, Florida.
As of 2022, Brown & Brown had a market cap of 17.77 billion and a return on equity of 12.96%. The company’s market cap is the total value of its outstanding shares, and its return on equity is a measure of its profitability. Brown & Brown is a diversified insurance agency that offers a range of insurance products and services to individuals, families, and businesses.
– Argentum 47 Inc ($OTCPK:ARGQ)
Argentum 47 Inc is a publicly traded company with a market capitalization of 310.86k as of 2022. The company has a return on equity of 33.4%. Argentum 47 Inc is engaged in the business of providing engineering and construction services.
– Ensurance Ltd ($ASX:ENA)
Ensurance Ltd is a provider of insurance and reinsurance products and services. The company has a market cap of 20.73M as of 2022 and a Return on Equity of 5.74%. Ensurance Ltd offers a variety of insurance and reinsurance products, including property and casualty, life and health, and specialty lines of insurance. The company also provides a range of reinsurance products, including property, casualty, and life reinsurance.
Summary
Investors in ARTHUR J. GALLAGHER & Co. should be encouraged by the company’s profitable second quarter of 2023, with total revenue rising 19.5% year over year to USD 2441.9 million. Net income came in at USD 234.5 million, representing a 17.5% drop from the same quarter in the prior year. Despite the decrease in profits, the company still managed to increase its revenue, indicating positive conditions for the remainder of the fiscal year. Investors should continue to monitor these earnings reports to gain a better understanding of ARTHUR J. GALLAGHER & Co.’s performance and potential investment opportunities going forward.
Related Posts


Recent Posts


Investing Everyone Can Do.
Investing shouldn’t be exclusive to a select few. We believe everyone should have the opportunity to grow their wealth. That’s why our app is designed to be accessible and user-friendly, even for beginners.
