EVOLUS INC Reports Record FY2022 Q4 Earnings Results for Period Ending December 31 2022
March 19, 2023

Earnings Overview
On March 8 2023, EVOLUS INC ($BER:EVL) reported their FY2022 Q4 earnings results for the period ending on December 31 2022.
Price History
On Wednesday, EVOLUS INC reported their record earnings results for the fourth quarter of their fiscal year 2022, ending December 31, 2022. The stock opened at €8.6 and closed at €8.4, down by 4.0% from its prior closing price of 8.7. In terms of outlook, the company expressed confidence in its ability to grow in the future, citing a strong product lineup and solid customer demand as key drivers of growth.
Overall, EVOLUS INC reported strong quarterly earnings for the fourth quarter of their fiscal year 2022, driving their stock down by 4.0% from its opening price. The company remains confident in their ability to continue to grow and deliver value to shareholders in the future. Live Quote…
About the Company
Income Snapshot
Below shows the total revenue, net income and net margin for Evolus Inc. More…
| Total Revenues | Net Income | Net Margin |
| 148.62 | -74.41 | -49.3% |
Cash Flow Snapshot
Below shows the cash from operations, investing and financing for Evolus Inc. More…
| Operations | Investing | Financing |
| -84.91 | -2.94 | -4.15 |
Balance Sheet Snapshot
Below shows the total assets, liabilities and book value per share for Evolus Inc. More…
| Total Assets | Total Liabilities | Book Value Per Share |
| 177.98 | 159.48 | 0.33 |
Key Ratios Snapshot
Some of the financial key ratios for Evolus Inc are shown below. More…
| 3Y Rev Growth | 3Y Operating Profit Growth | Operating Margin |
| 62.0% | – | -43.9% |
| FCF Margin | ROE | ROA |
| -59.1% | -170.8% | -22.9% |
Analysis
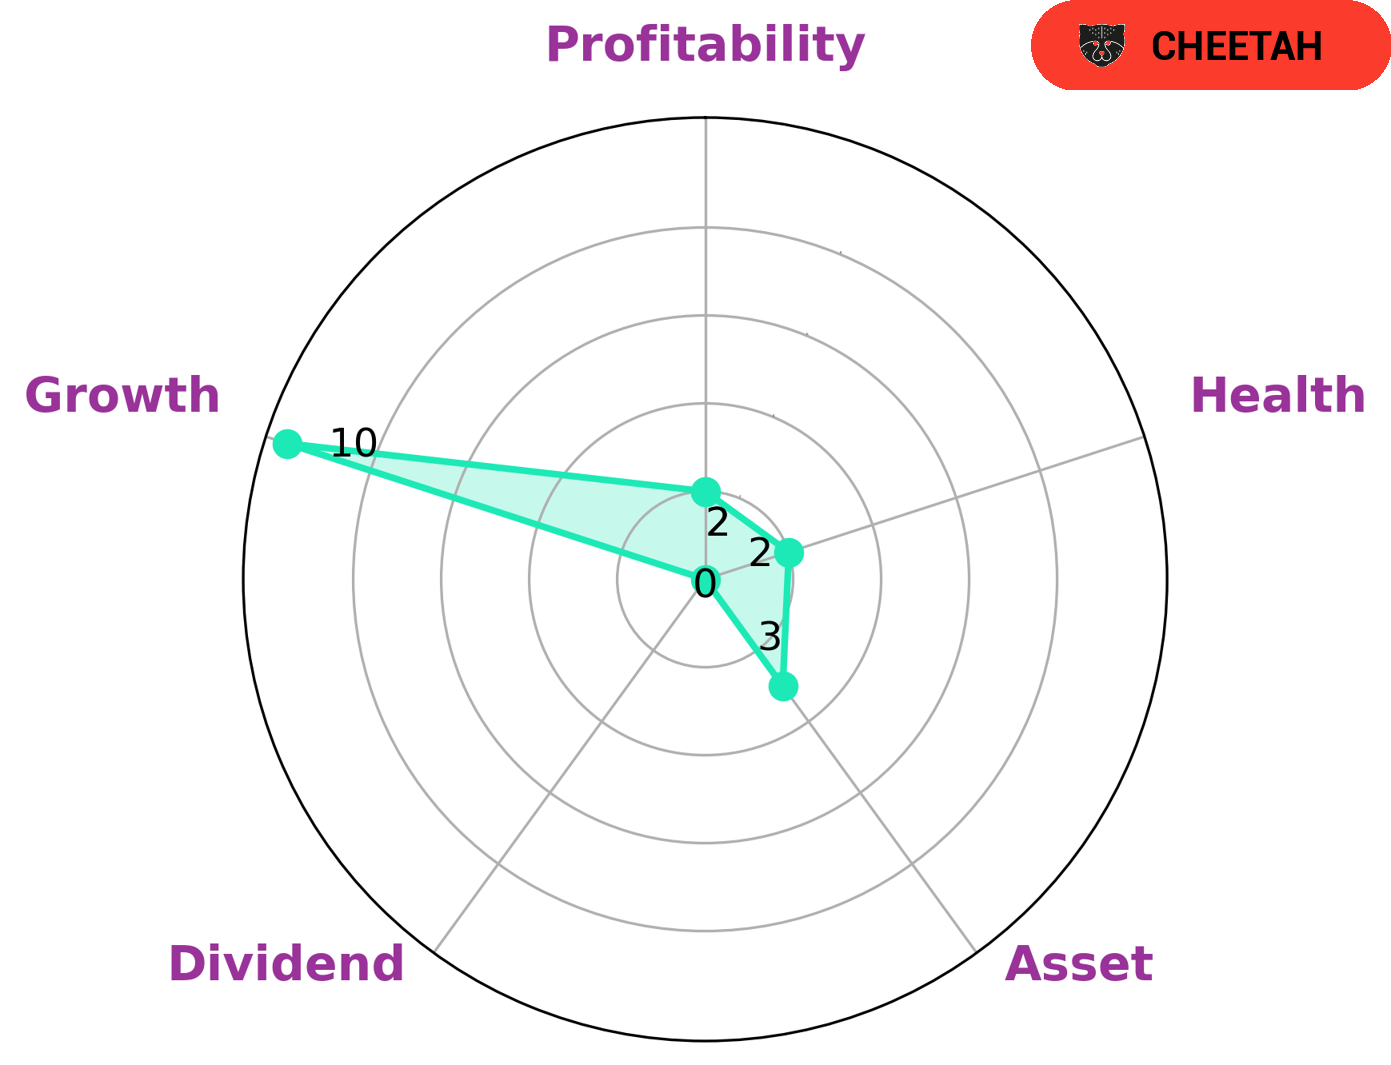
At GoodWhale, we conducted an analysis of EVOLUS INC‘s fundamentals. Our Star Chart classified EVOLUS INC as a ‘cheetah’, a type of company that has achieved high revenue or earnings growth, but is considered less stable due to lower profitability. Given this classification, we can infer that investors interested in this type of company may be seeking higher-than-average growth potential. In terms of strengths, EVOLUS INC demonstrated strong growth and weak asset, dividend, and profitability figures. However, our health score of 2/10 with regard to its cashflows and debt indicates that it is less likely to be able to sustain operations in the future during times of economic hardship. More…
Summary
EVOLUS INC‘s Q4 earnings for FY2022 have been reported, showing a 27.6% increase in revenue year-over-year and a 25.9% jump in net income. This is a positive sign and could indicate that the company’s performance is strong, as well as increasing investor confidence. However, the share price of EVOLUS INC dropped on the same day of the report, which may be a sign of caution among investors. Overall, EVOLUS INC looks to be in a good financial position and may be worth considering as an investment opportunity.
Related Posts


Recent Posts


