Ternium S.a dividend yield – Ternium SA Declares 1.8 Cash Dividend
May 27, 2023

Dividends Yield
On May 26 2023, Ternium SA declared a 1.8 Cash Dividend. This marks the fourth consecutive year of dividend payments per share for the company. In the past three years, TERNIUM S.A ($NYSE:TX) has made annual dividend payments per share of 2.7, 2.7, and 2.9 USD, which yields 7.61%, 7.61%, and 7.4% respectively. The average dividend yield for the company is 7.54%. With this announcement of 1.8 Cash Dividend, the ex-dividend date is May 4, 2023.
If you’re interested in dividend stocks, TERNIUM S.A should be on your list of considerations. With their consistent annual dividend payments and high dividend yields, they are a reliable option for those looking to invests in dividend stocks. With the ex-dividend date of May 4, 2023, now is the perfect time to invest in TERNIUM S.A and take advantage of their generous dividend yields.
Price History
The announcement was made on the day that the company’s stock opened at $38.6 and closed at $38.5, up by 0.5% from its prior closing price of 38.3. Live Quote…
About the Company
Income Snapshot
Below shows the total revenue, net income and net margin for Ternium S.a. More…
| Total Revenues | Net Income | Net Margin |
| 15.73k | 1.37k | 9.7% |
Cash Flow Snapshot
Below shows the cash from operations, investing and financing for Ternium S.a. More…
| Operations | Investing | Financing |
| 2.67k | -2.15k | -1.05k |
Balance Sheet Snapshot
Below shows the total assets, liabilities and book value per share for Ternium S.a. More…
| Total Assets | Total Liabilities | Book Value Per Share |
| 17.91k | 3.65k | 62.3 |
Key Ratios Snapshot
Some of the financial key ratios for Ternium S.a are shown below. More…
| 3Y Rev Growth | 3Y Operating Profit Growth | Operating Margin |
| 17.4% | 44.6% | 13.1% |
| FCF Margin | ROE | ROA |
| 12.8% | 10.7% | 7.2% |
Analysis
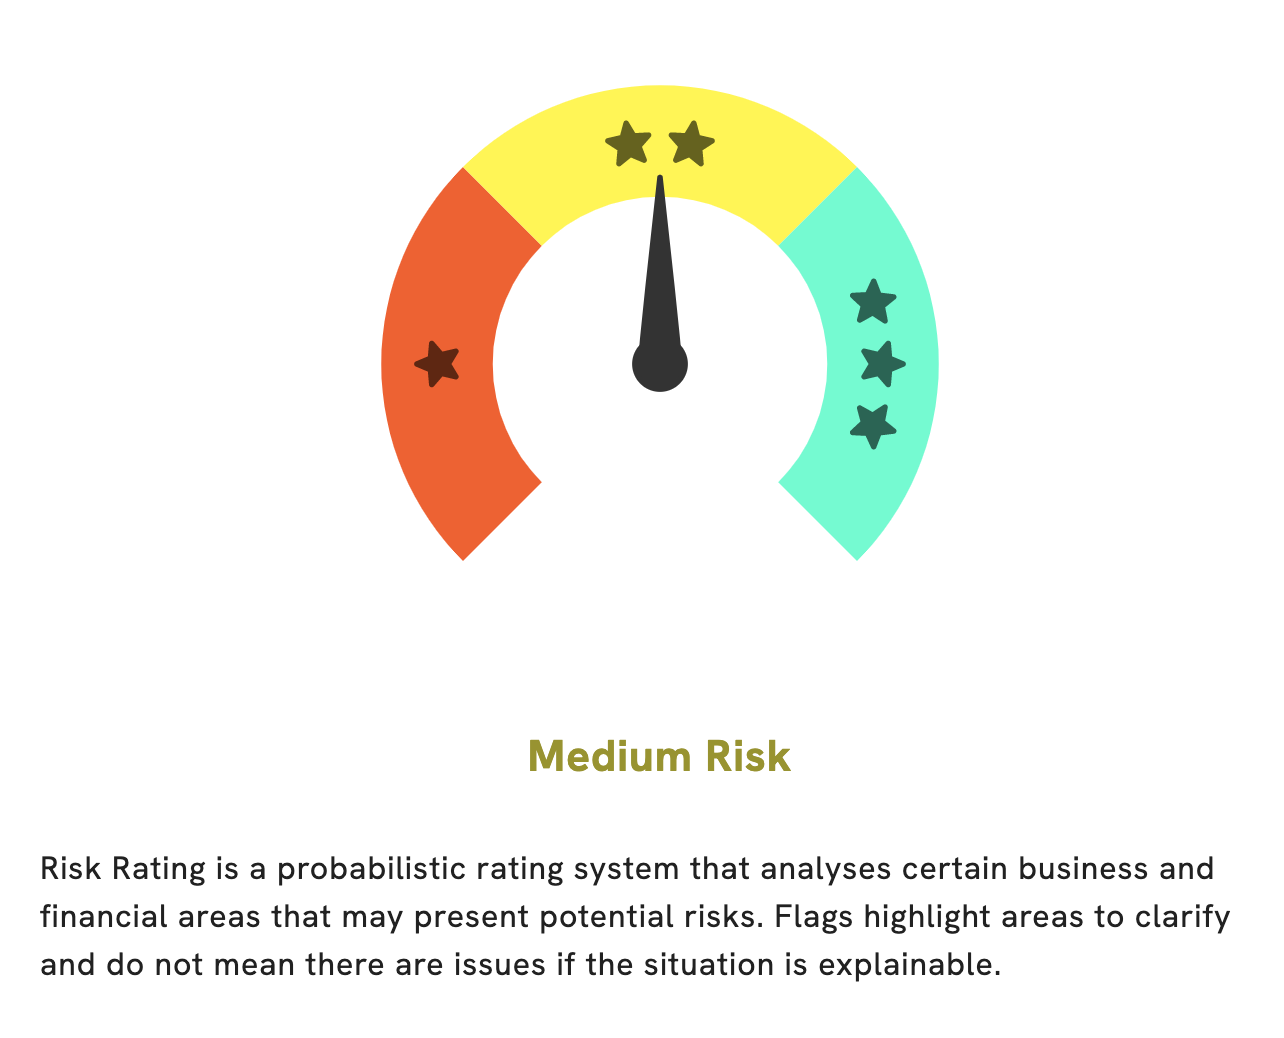
At GoodWhale, we recently conducted an analysis of TERNIUM S.A.’s financial and business wellbeing. After evaluation, we have concluded that TERNIUM S.A. is a medium risk investment. Our Risk Rating places TERNIUM S.A. as a company that holds enough financial and business assurances to make an investment worthwhile but also requires sufficient due diligence to ensure that it is a safe and sound investment. Furthermore, our analysis has highlighted one risk warning in TERNIUM S.A.’s balance sheet. To gain more insight into this risk warning and better inform your decision-making process, please register with us to learn more. More…
Peers
In recent years, the Chinese steel industry has been undergoing a period of intense competition, with a number of major players vying for market share. Among them, Ternium SA has emerged as a key competitor, particularly in the production of high-quality steel products. The company has invested heavily in research and development in order to maintain its position as a leading player in the industry, and this has paid off in terms of both market share and profitability. While Ternium faces stiff competition from a number of other major Chinese steel producers, it is well-positioned to continue its growth in the years ahead.
– Lingyuan Iron & Steel Co Ltd ($SHSE:600231)
Lingyuan Iron & Steel Co Ltd is a Chinese steel producer with a market cap of $5.88B as of 2022. The company has a Return on Equity of -2.8%. Lingyuan Iron & Steel Co Ltd produces a variety of steel products including pipes, plates, and coils. The company has over 3,500 employees and operates in China, Europe, and the United States.
– Daehan Steel Co Ltd ($KOSE:084010)
Daehan Steel Co Ltd is a South Korean steel manufacturer. The company has a market cap of 232.09B as of 2022 and a Return on Equity of 28.52%. Daehan Steel Co Ltd is a leading manufacturer of steel products in South Korea. The company produces a wide range of steel products, including hot rolled coils, cold rolled coils, galvanized steel coils, and pre-painted steel coils.
– Xinjiang Ba Yi Iron & Steel Co Ltd ($SHSE:600581)
Xinjiang Ba Yi Iron & Steel Co Ltd is a Chinese steel company with a market cap of 5.72 billion as of 2022. The company has a Return on Equity of -24.16%. The company is involved in the production of iron and steel products.
Summary
Investing in TERNIUM S.A can be attractive for those seeking to grow their dividend income as the company has maintained a consistent dividend yield of around 7.54% over the past three years. Annual dividend payments per share have remained stable at 2.7 and 2.9 USD in the past two years, providing investors with a reliable income stream. Investors should note that while dividend payments may fluctuate over time, the company has demonstrated a commitment to maintaining a sustainable dividend rate.
Related Posts


Recent Posts


