NEO dividend yield – NEO PERFORMANCE MATERIALS Declares 0.1 Cash Dividend
June 12, 2023

🌥️Dividends Yield
On June 1, 2023, NEO PERFORMANCE MATERIALS ($TSX:NEO) announced that it will declare a 0.1 USD cash dividend. This is the fourth dividend declaration for this company, following 0.3 USD, 0.3 USD and 0.32 USD dividends per share in the last three years. NEO PERFORMANCE MATERIALS has a dividend yield of 3.4%, 3.09% and 2.14% for the 2021-2023 period with an average yield of 2.88%. If you are looking for a dividend stock investment, NEO PERFORMANCE MATERIALS is worth considering.
The ex-dividend date is June 19, 2023, so investors will need to own the stock before this date to qualify for the dividend payment. NEO PERFORMANCE MATERIALS is a reliable dividend stock with a steady history of dividend payments that have been growing year over year. The company promises sustainable returns to its shareholders, making it a great option for investors seeking a good dividend-yielding stock.
Market Price
On Thursday, the company’s stock opened at CA$8.3 and closed at CA$8.2, showing a decrease of 0.4% from its previous closing price of CA$8.3. Live Quote…
About the Company
Income Snapshot
Below shows the total revenue, net income and net margin for NEO. More…
| Total Revenues | Net Income | Net Margin |
| 609.55 | -6.86 | 0.8% |
Cash Flow Snapshot
Below shows the cash from operations, investing and financing for NEO. More…
| Operations | Investing | Financing |
| 52.65 | -14.16 | 47.77 |
Balance Sheet Snapshot
Below shows the total assets, liabilities and book value per share for NEO. More…
| Total Assets | Total Liabilities | Book Value Per Share |
| 644.83 | 178.13 | 10.26 |
Key Ratios Snapshot
Some of the financial key ratios for NEO are shown below. More…
| 3Y Rev Growth | 3Y Operating Profit Growth | Operating Margin |
| 16.1% | -0.4% | 1.1% |
| FCF Margin | ROE | ROA |
| 6.3% | 0.9% | 0.6% |
Analysis
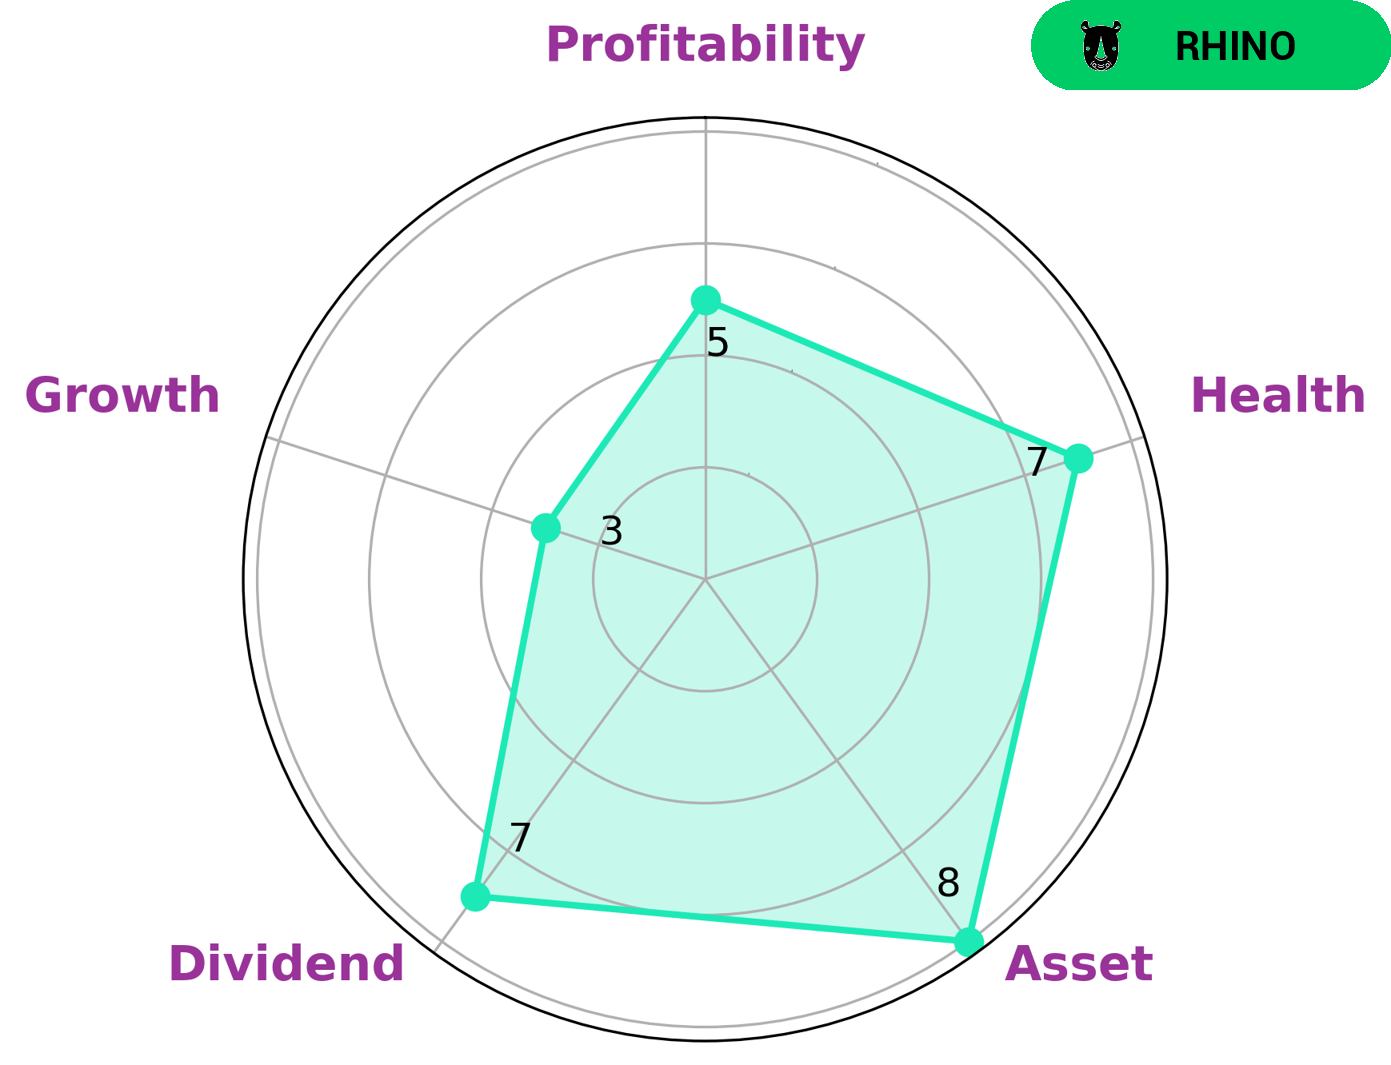
At GoodWhale, we analyzed NEO PERFORMANCE MATERIALS’s financials and based on our Star Chart, we classified the company as a ‘rhino’, which implies that the company has achieved moderate revenue or earnings growth. Investors who may be interested in such a company are those who are looking for a relatively safe and consistent investment. NEO PERFORMANCE MATERIALS has a high Health Score of 7/10, indicating that it is capable of paying off debt and funding future operations. When reviewing their financials, NEO PERFORMANCE MATERIALS is strong in both assets and dividends, medium in profitability, and weak in growth. Ultimately, investors who are looking for consistent and safe returns may find NEO PERFORMANCE MATERIALS to be an attractive option. More…
Peers
The company’s products include rare earth metals and alloys, as well as a variety of other materials. Neo Performance Materials Inc’s competitors include 5N Plus Inc, Zeon Corp, and NOF Corp.
– 5N Plus Inc ($TSX:VNP)
Hanesbrands Inc. is a publicly traded clothing company based in Winston-Salem, North Carolina. The company was founded in 1901 and has since grown to become one of the largest clothing manufacturers in the world. Hanesbrands Inc. is best known for its underwear, t-shirts, and socks. The company also manufactures a variety of other clothing items including outerwear, sleepwear, and hosiery. Hanesbrands Inc. has a market cap of 178.43M as of 2022 and a Return on Equity of 1.18%. The company’s products are sold in over 50 countries around the world and it has over 60,000 employees.
– Zeon Corp ($TSE:4205)
Zeon Corporation is a Japanese chemical company that was founded in 1950. The company is headquartered in Tokyo, Japan, and its products include synthetic rubber, plastics, and chemicals. Zeon Corporation has a market cap of 268.61B as of 2022, and a return on equity of 8.53%. The company’s products are used in a variety of industries, including automotive, electronics, and healthcare.
– NOF Corp ($TSE:4403)
As of 2022, NOF Corp has a market cap of 417.73B and a Return on Equity of 12.06%. The company is engaged in the business of providing services to the oil and gas industry.
Summary
Investors interested in dividend stocks could consider NEO PERFORMANCE MATERIALS as a potential option. Over the last three years, the company has paid out dividends amounting to 0.3, 0.3 and 0.32 USD per share respectively, resulting in an average yield of 2.88%. With a dividend yield of 3.4% in 2021, 3.09% in 2022 and 2.14% in 2023, NEO PERFORMANCE MATERIALS provides a modest return on investment and could be a good choice for income-seeking investors seeking moderate gains over the short term.
Related Posts


Recent Posts


Investing Everyone Can Do.
Investing shouldn’t be exclusive to a select few. We believe everyone should have the opportunity to grow their wealth. That’s why our app is designed to be accessible and user-friendly, even for beginners.
