Mullen Group dividend yield calculator – Mullen Group Ltd Announces 0.06 Cash Dividend
June 3, 2023

🌥️Dividends Yield
Mullen Group ($TSX:MTL) Ltd Announces 0.06 Cash Dividend on May 25th, 2023. The company has been paying out an annual dividend per share of 0.71 CAD, 0.68 CAD, and 0.48 CAD over the past three years, with yields of 5.18%, 5.13%, and 3.88% respectively; giving an average yield of 4.73%. If you are looking for a reliable dividend stock, Mullen Group may be a good option to consider, with an ex-dividend date of May 30, 2023.
The dividend yield is attractive and you will benefit from the dividend income paid out on a regular basis. Investing in Mullen Group is a great way to generate a steady stream of income while also securing your financial future.
Price History
On the same day, the stock opened at CA$15.5 and closed at the same price, rising by 0.1% from its previous closing price of CA$15.5. The company has a long history of providing reliable dividends and continues to be a reliable investment for shareholders. Live Quote…
About the Company
Income Snapshot
Below shows the total revenue, net income and net margin for Mullen Group. More…
| Total Revenues | Net Income | Net Margin |
| 2.04k | 173.89 | 7.7% |
Cash Flow Snapshot
Below shows the cash from operations, investing and financing for Mullen Group. More…
| Operations | Investing | Financing |
| 279.23 | -47.99 | -220.23 |
Balance Sheet Snapshot
Below shows the total assets, liabilities and book value per share for Mullen Group. More…
| Total Assets | Total Liabilities | Book Value Per Share |
| 2.02k | 1.07k | 9.99 |
Key Ratios Snapshot
Some of the financial key ratios for Mullen Group are shown below. More…
| 3Y Rev Growth | 3Y Operating Profit Growth | Operating Margin |
| 16.9% | 37.6% | 13.0% |
| FCF Margin | ROE | ROA |
| 9.2% | 17.3% | 8.2% |
Analysis
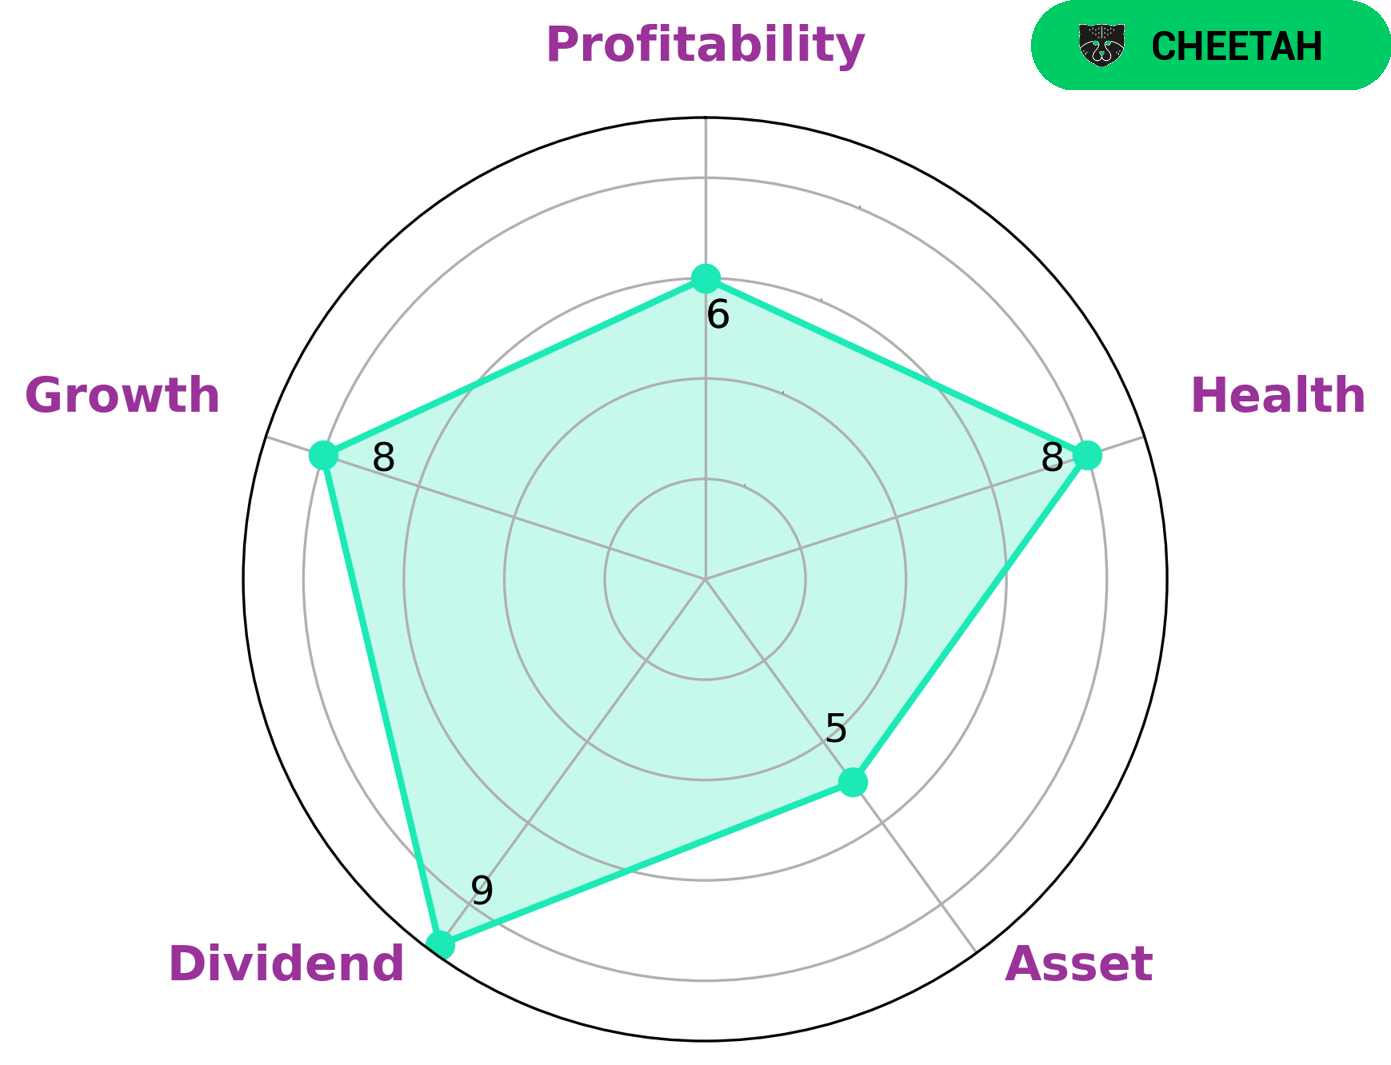
At GoodWhale, we recently ran an analysis of MULLEN GROUP‘s fundamentals. Our results show that MULLEN GROUP’s health score, as determined by our Star Chart tool, is 8 out of 10, indicating a strong ability to sustain future operations even in times of crisis. Further, we observed that the company is strong in dividend and growth, and medium in asset and profitability. Based on this assessment, we classify MULLEN GROUP as a ‘cheetah’ – that is, a company that has achieved high revenue or earnings growth, but is considered less stable due to lower profitability. This makes MULLEN GROUP an attractive investment option for investors looking for impressive growth potential and are willing to take on greater risk. Those who prefer a more conservative approach may want to seek other investments. More…
Peers
The company operates in a highly competitive industry with several large competitors, including United Express Inc, Universal Logistics Holdings Inc, and USA Truck Inc. Mullen Group has a long history of success in the industry and is well-positioned to continue its growth and market share gains in the coming years.
– United Express Inc ($OTCPK:UNXP)
United Express Inc is a regional airline that operates under the brand United Express. The company is headquartered in Chicago, Illinois and is a subsidiary of United Airlines. United Express Inc flies to over 200 destinations across the United States, Canada, and Mexico. The company has a fleet of over 400 aircraft and employs over 4,000 people.
– Universal Logistics Holdings Inc ($NASDAQ:ULH)
The company’s market cap is 925.76M as of 2022, a Return on Equity of 29.13%. The company is a provider of transportation and logistics services. It offers a full range of services, including: truckload and less-than-truckload transportation, intermodal, contract logistics, warehousing, and freight management.
Summary
MULLEN GROUP is a good option for investors who are looking for reliable dividend yields. Over the past three years, the company has paid out annual dividends per share of 0.71 CAD, 0.68 CAD, and 0.48 CAD, which translates to dividend yields of 5.18%, 5.13%, and 3.88% respectively in 2021 to 2023. The average yield of 4.73% is higher than the benchmark yield for the sector, making MULLEN GROUP a desirable investment option. Analysts have noted that MULLEN GROUP has solid fundamentals and has consistently delivered steady returns in the past.
Related Posts


Recent Posts


Investing Everyone Can Do.
Investing shouldn’t be exclusive to a select few. We believe everyone should have the opportunity to grow their wealth. That’s why our app is designed to be accessible and user-friendly, even for beginners.
