Founder’s Consultants dividend yield calculator – Founder’s Consultants Holdings Declares Special Dividend of 5.0
June 3, 2023

☀️Dividends Yield
On June 2 2023, Founder’s Consultants ($TSE:6542) Holdings Inc. announced a special dividend of 5.0 JPY per share. This follows their previous dividends, which included 25.0 JPY in 2021 and 25.0 JPY in 2022. The dividend yield for these years was 3.37%, and the yield for 2023 was 2.42%, resulting in an average yield of 3.05%.
For investors seeking dividend stocks, this company may be worth considering, with its ex-dividend date on June 29 2023. It has consistently paid out dividends since its founding, making it a reliable source of income for those looking for a steady return on their investments.
Price History
The company’s stock opened at JP¥852.0 and closed at JP¥845.0, representing a decrease of 0.7% from the previous closing price of 851.0. This announcement marks the first special dividend declared by the company since its establishment, and the dividend is payable to shareholders as of the date of the announcement. This special dividend is expected to further strengthen FOUNDER’S CONSULTANTS Holdings Inc.’s financial flexibility and boost investor confidence in the company. The company is committed to creating value for its shareholders and will continue to look for opportunities to do so. Live Quote…
About the Company
Income Snapshot
Below shows the total revenue, net income and net margin for Founder’s Consultants. More…
| Total Revenues | Net Income | Net Margin |
| 8.43k | 661.36 | 7.8% |
Cash Flow Snapshot
Below shows the cash from operations, investing and financing for Founder’s Consultants. More…
| Operations | Investing | Financing |
| 617.68 | -143.56 | -750.02 |
Balance Sheet Snapshot
Below shows the total assets, liabilities and book value per share for Founder’s Consultants. More…
| Total Assets | Total Liabilities | Book Value Per Share |
| 11.62k | 5.08k | 1.05k |
Key Ratios Snapshot
Some of the financial key ratios for Founder’s Consultants are shown below. More…
| 3Y Rev Growth | 3Y Operating Profit Growth | Operating Margin |
| 3.1% | 9.6% | 13.2% |
| FCF Margin | ROE | ROA |
| 5.1% | 10.9% | 6.0% |
Analysis
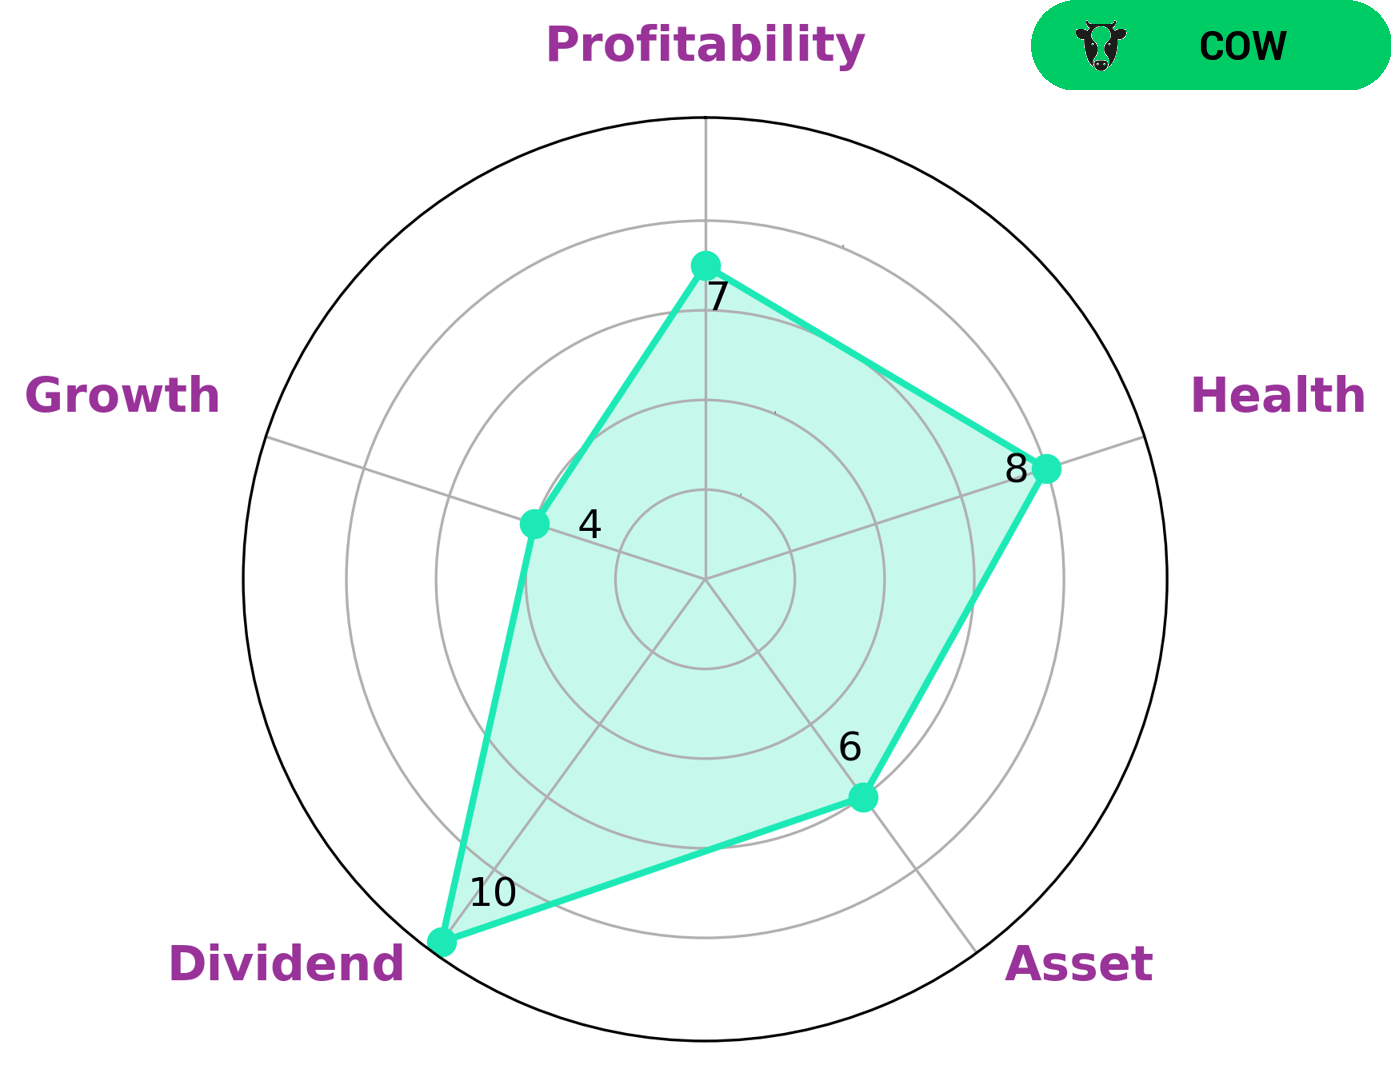
GoodWhale has conducted an analysis of the fundamentals of FOUNDER’S CONSULTANTS. The results from our Star Chart have given the company a high health score of 8/10, which indicates that FOUNDER’S CONSULTANTS is in a strong financial position and is capable of not only paying off its existing debt, but also funding future operations. Looking at specific performance measures, FOUNDER’S CONSULTANTS ranks highly on dividends and profitability, and in the medium range for asset and growth. This means that it is very likely to be able to sustain the payment of consistent and stable dividends, making it an attractive option for income-seeking investors. We believe this company to be classified as a ‘cow’, meaning it is an excellent stock for long-term investors. More…
Peers
It is one of many firms operating in the industry, competing with other notable players such as Tarmat Ltd, Kitano Construction Corp, and Vishvprabha Ventures Ltd. These rivals are all leaders in their respective fields, offering robust solutions and services in their respective areas of expertise. Founder’s Consultants Holdings Inc is aiming to provide a unique service to their clients that will set it apart from its competitors.
– Tarmat Ltd ($BSE:532869)
Tarmat Ltd is a leading global provider of innovative solutions for the energy, transportation, and industrial sectors. With a market capitalization of 1.78 billion in 2023, the company is well-positioned to capitalize on future growth opportunities. The company’s Return on Equity (ROE) of 3.74% is indicative of its ability to generate profits for shareholders. Tarmat’s wide range of offerings and their expertise in the industry has allowed them to become a leader in their respective markets.
– Kitano Construction Corp ($TSE:1866)
Kitano Construction Corp is a leading construction company headquartered in Tokyo, Japan. With over two decades of experience in the construction industry, the company has built a strong reputation for delivering high-quality services to its clients. Its current market capitalization stands at 17.37 billion as of 2023, depicting the company’s stability and success in the industry. Additionally, the return on equity of 8.34% reflects Kitano Construction’s success in generating profits from the investments it makes. The company has established itself as one of the premier providers of construction services in Japan, setting a benchmark in the industry.
– Vishvprabha Ventures Ltd ($BSE:512064)
Vishvprabha Ventures Ltd is an India-based business enterprise operating in the consumer goods industry. The company offers a wide range of products, such as home and kitchen appliances, fashion and apparel, furniture, and other consumer goods. As of 2023, the company’s market cap stands at 154.35M, indicating its current size and value. Vishvprabha Ventures Ltd’s Return on Equity (ROE) is -2.59%, which is lower than industry averages in the consumer goods sector. This suggests that the company is not generating revenues or profits as efficiently as other businesses in the same sector.
Summary
Investing in FOUNDER’S CONSULTANTS could be a smart choice for investors looking for reliable dividend yields. Over the last three years, the company has issued a dividend of 25.0 JPY, 25.0 JPY, and 16.53 JPY per share, resulting in dividend yields of 3.37%, 3.37%, and 2.42% respectively. The average dividend yield for the company is 3.05%, which is higher than the current market average. Furthermore, the company has a consistent track record of paying dividends, making it an attractive option for those who prioritize stable income streams.
Related Posts


Recent Posts


Investing Everyone Can Do.
Investing shouldn’t be exclusive to a select few. We believe everyone should have the opportunity to grow their wealth. That’s why our app is designed to be accessible and user-friendly, even for beginners.
